
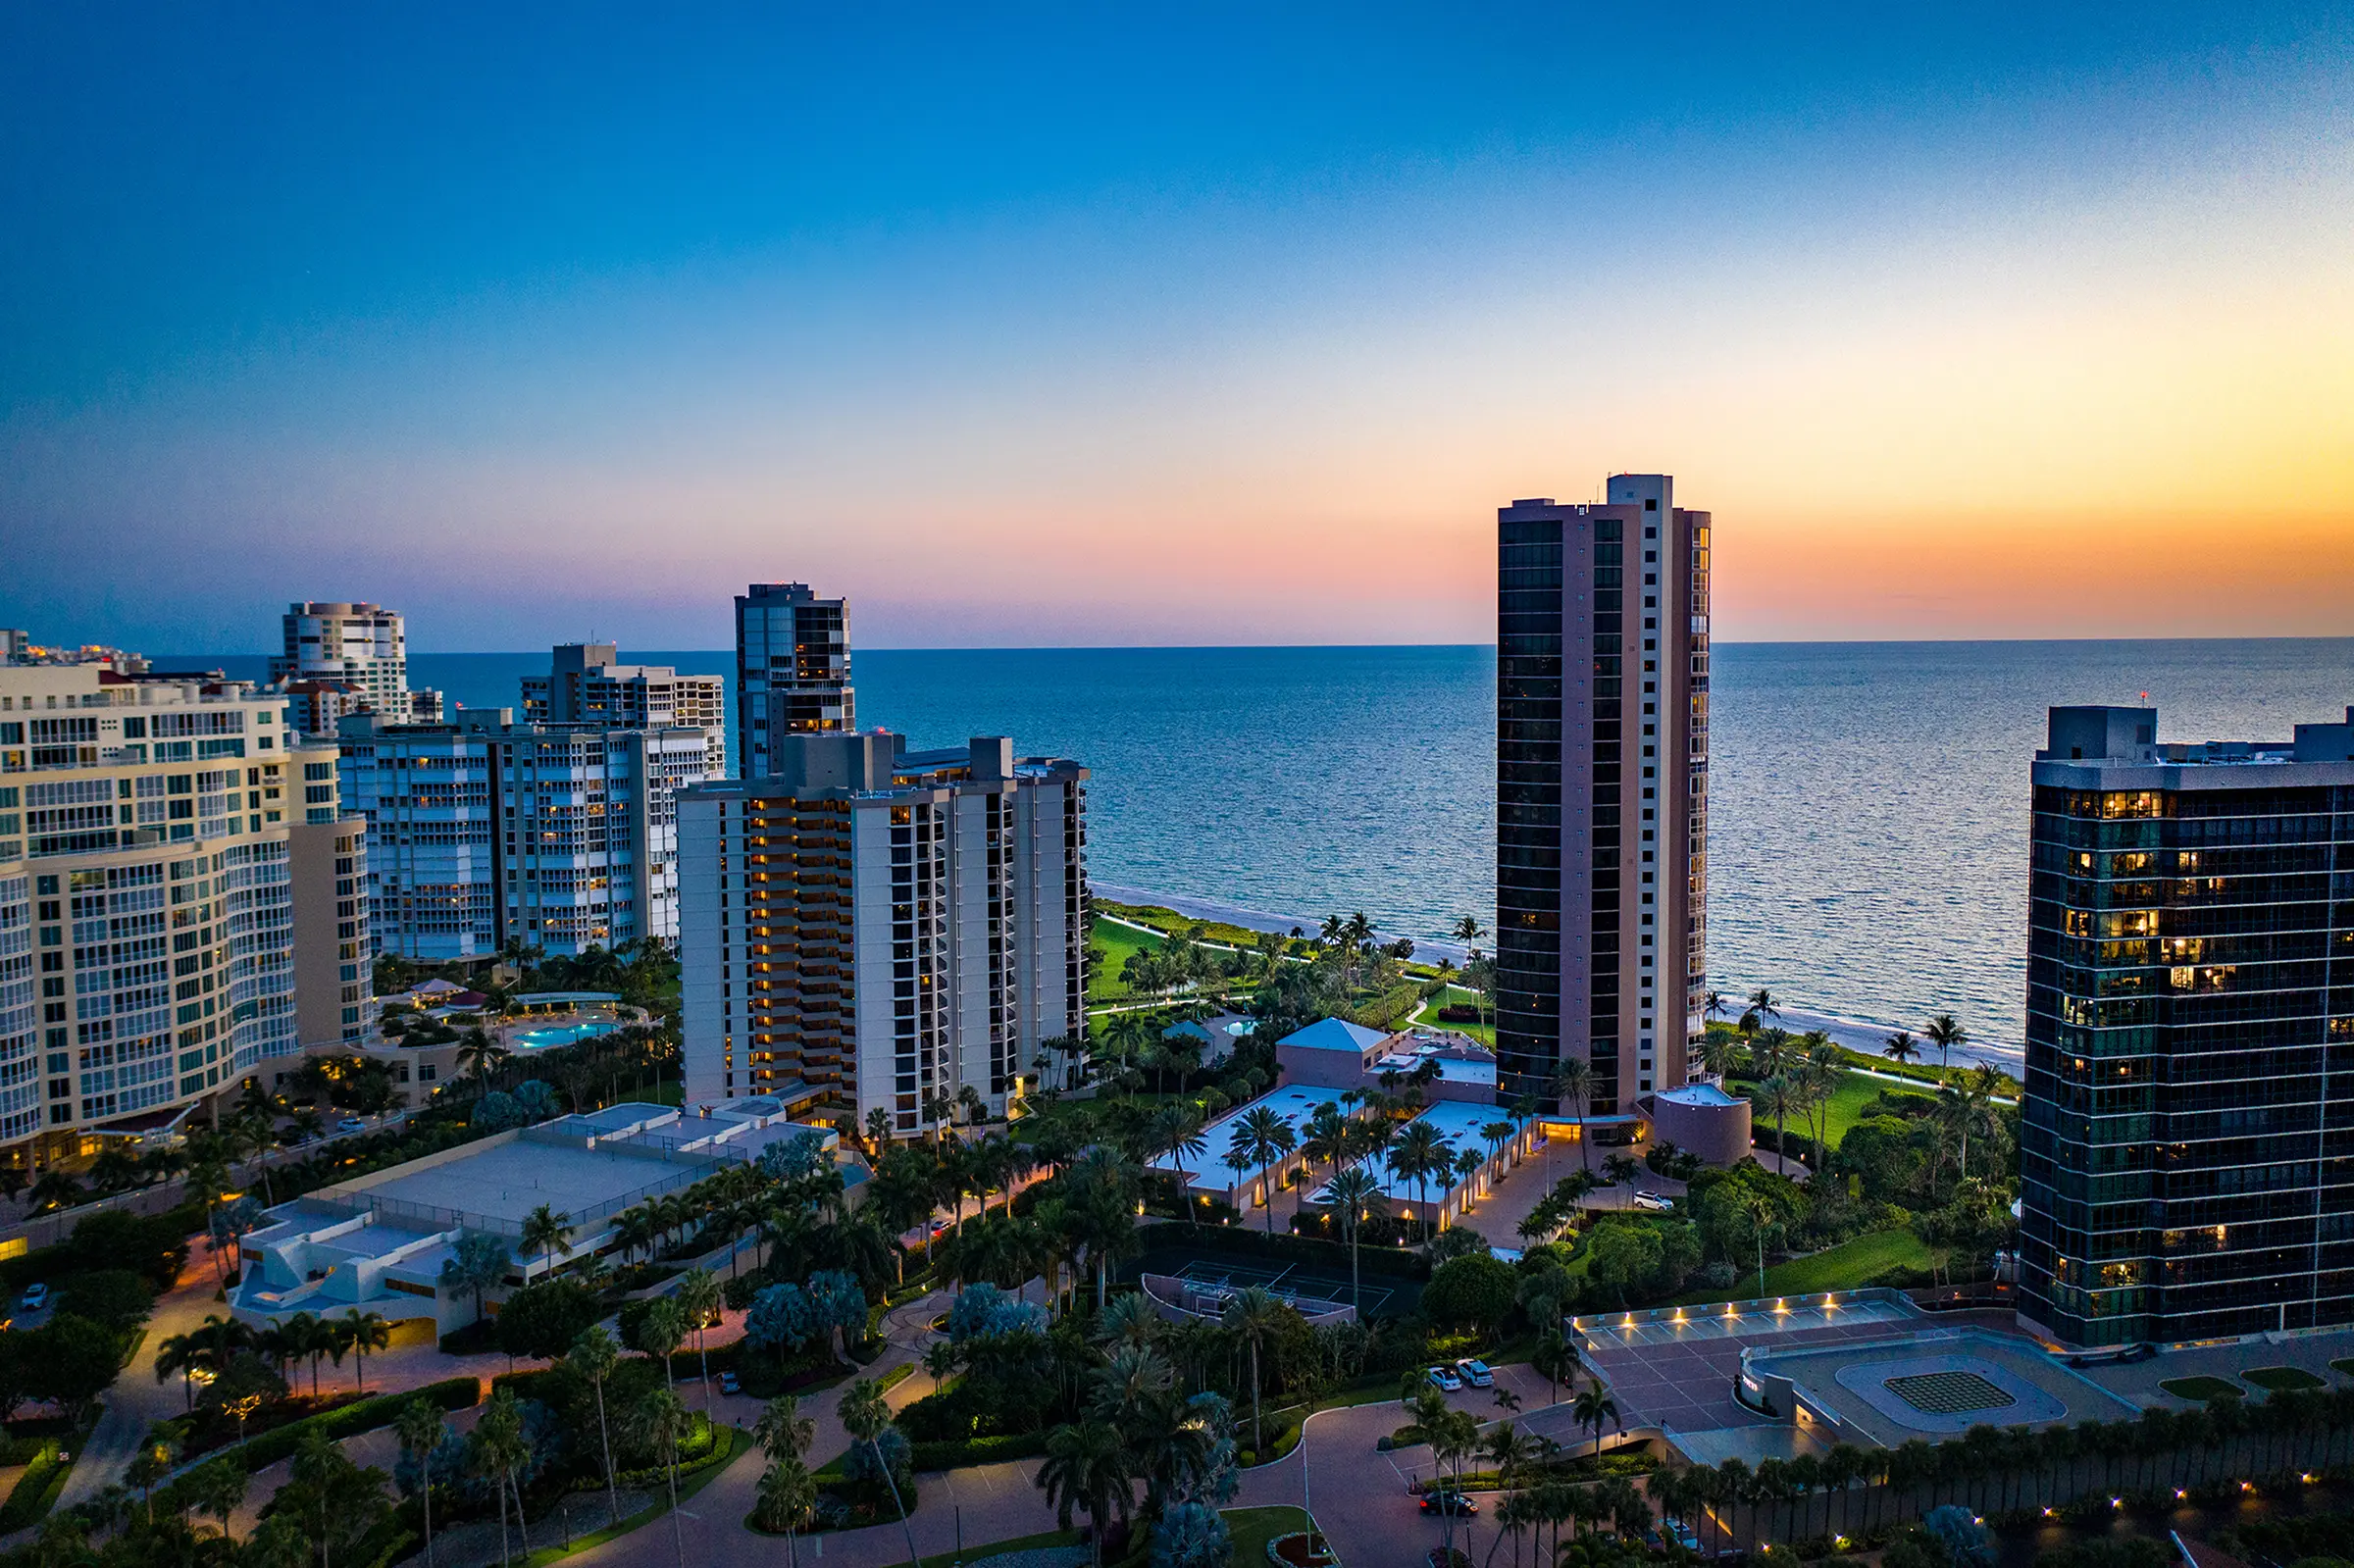
Park Shore sales are up 40% on the year, the premium high-rise towers have almost nothing for sale, and home sellers are asking 14% more than buyers pay.
We pull the Park Shore numbers from the MLS every month and publish them here in full: inventory, months of supply, price per square foot and what actually closed, broken out for the beachfront high-rise towers, the other condominiums and the single-family homes, and tower by tower. This edition covers the twelve months from October 1, 2025 to September 30, 2026, compared with the twelve months before, and inventory as of October 1, 2026.
September 2026 — Inventory
| Segment | Listed | Supply |
|---|---|---|
| Beachfront towers | 58 active 4 pending |
6.2 months |
| Other condominiums | 38 active 4 pending |
4.7 months |
| Single-family homes | 25 active 5 pending |
5.8 months |
| All Park Shore | 121 active 13 pending |
5.6 months |
Months of supply compares the residences offered today with the pace of sales over the last twelve months. Across Park Shore there are about five and a half months of supply, which is a roughly balanced market. The beachfront towers carry just over six months, the single-family homes close to six and the other condominiums close to five.
Twelve-Month Performance
| Segment | Sales | Per Sq Ft |
|---|---|---|
| Beachfront towers Median $2,037,500 |
112 78 prior year |
$902 $1,090 prior year |
| Other condominiums Median $835,000 |
97 79 prior year |
$503 $465 prior year |
| Single-family homes Median $4,890,000 |
52 30 prior year |
$1,255 $1,292 prior year |
| All Park Shore Median $1,800,000 |
261 187 prior year |
$823 $846 prior year |
Sales rose to 261 from 187 the year before, and dollar volume to $714.7 million from $473.3 million, up 51%. Every segment sold more: the towers 44% more, the other condominiums 23% more and the single-family homes 73% more. The median sale closed at 90% of its original asking price, against 88% the year before, and 93% of its final one, after a median of 86 days on the market, down from 100.
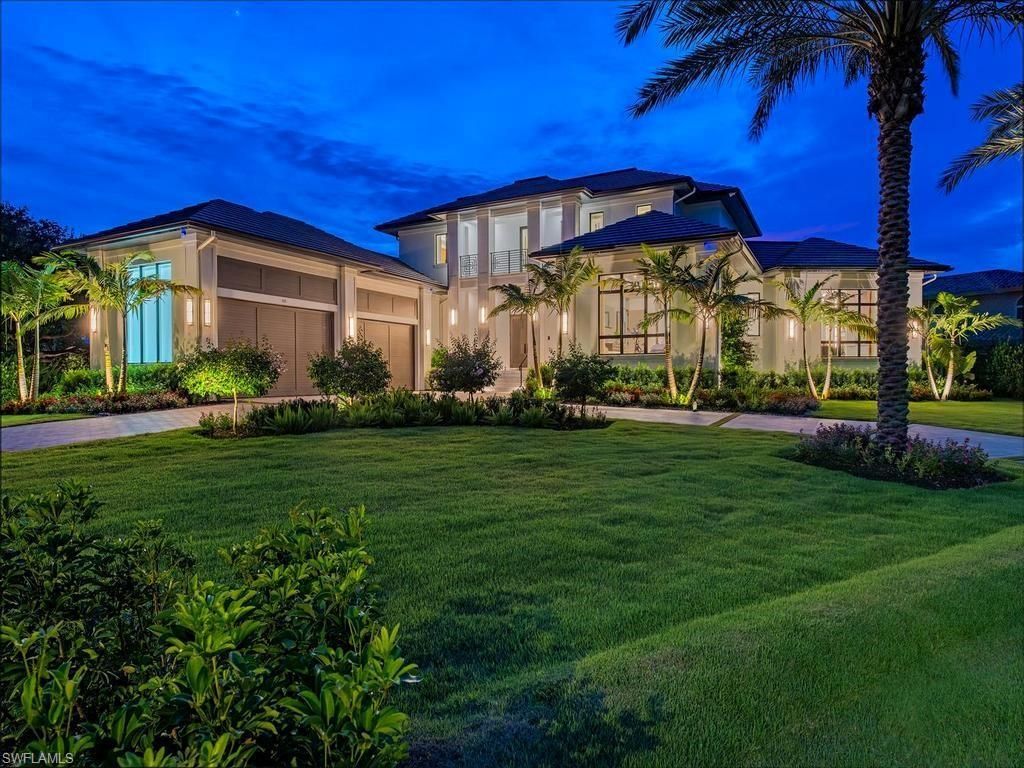
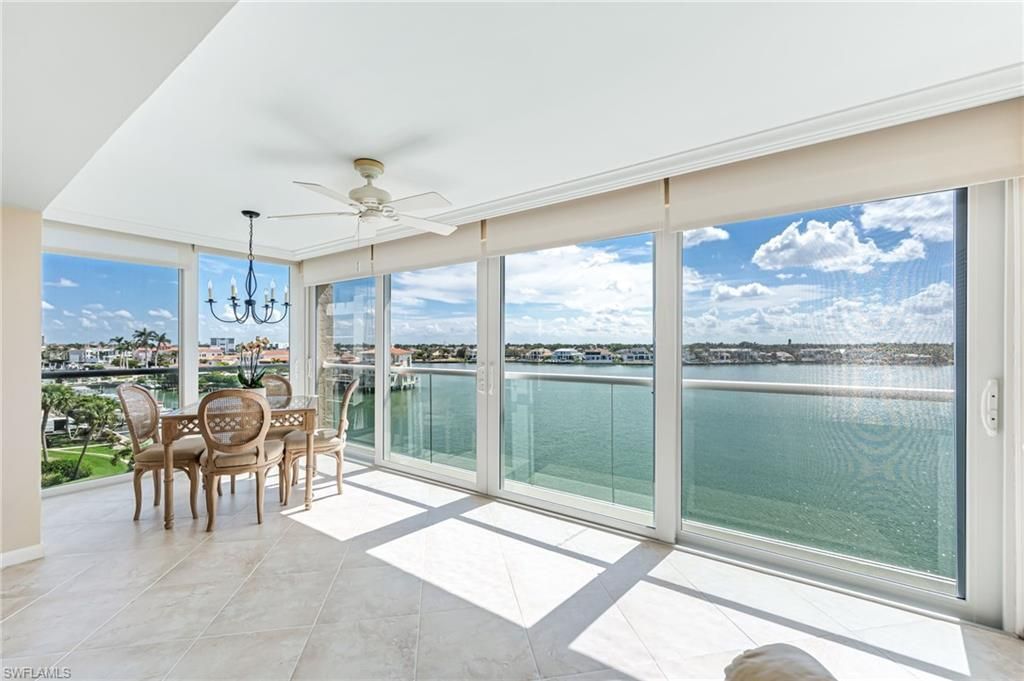
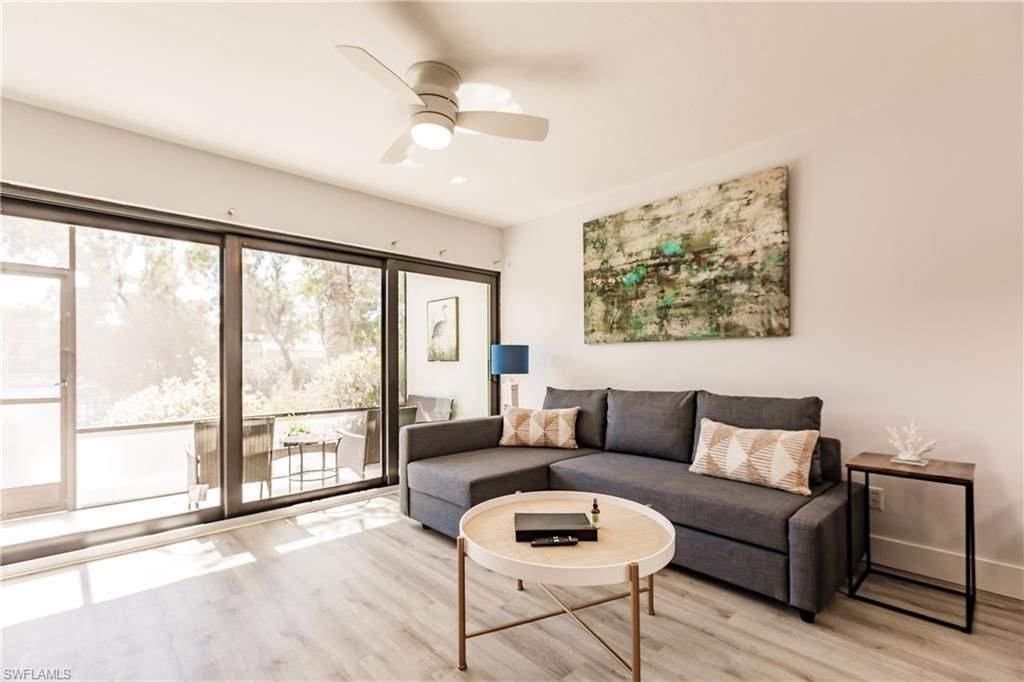
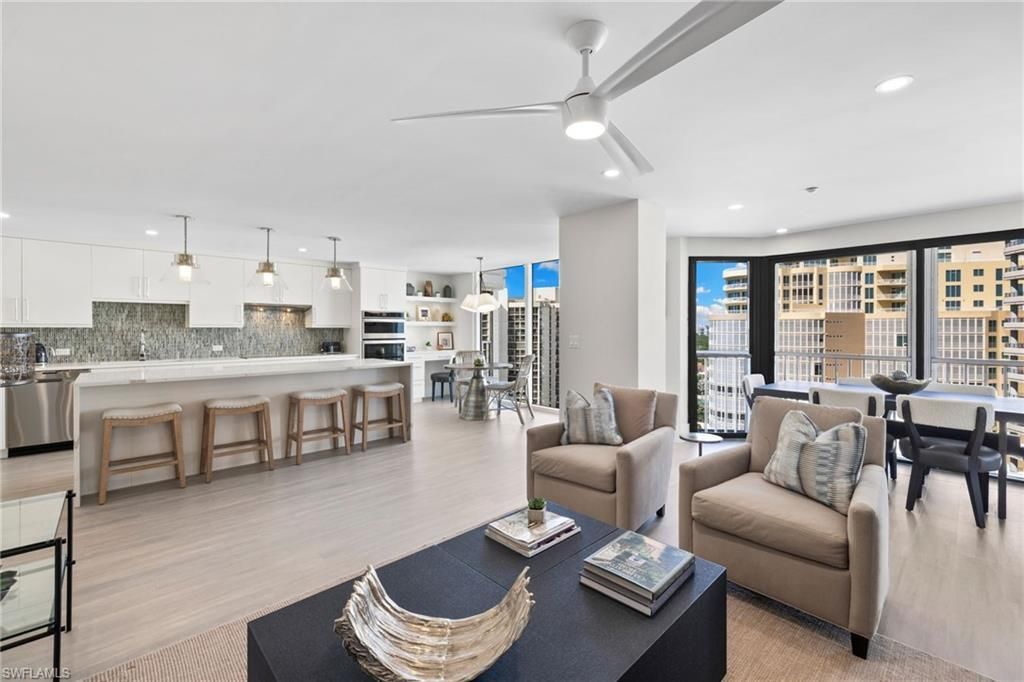
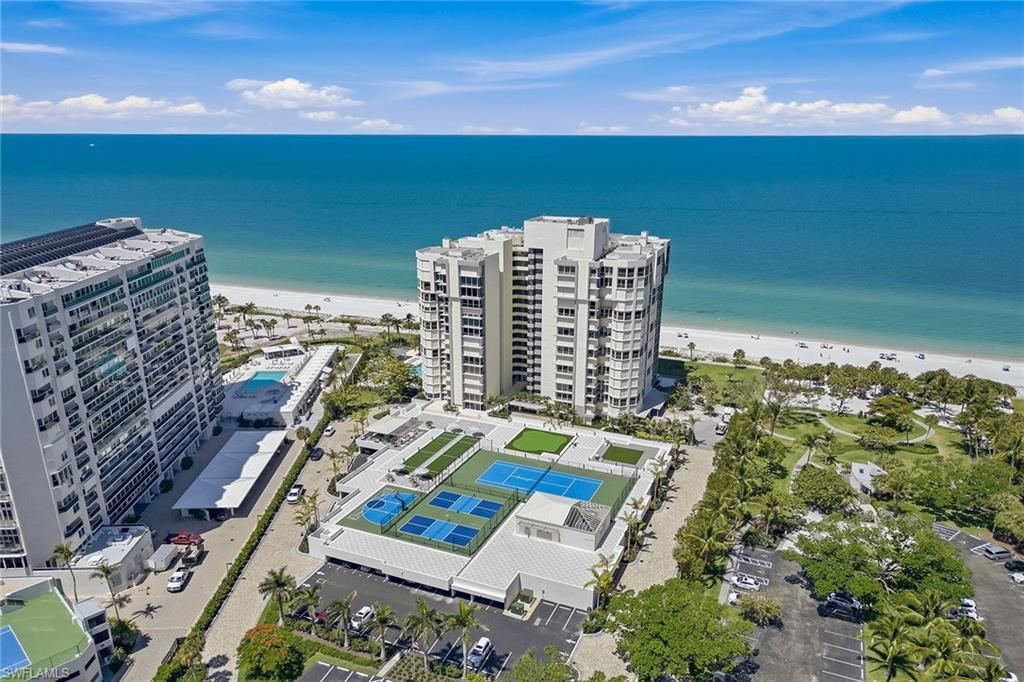
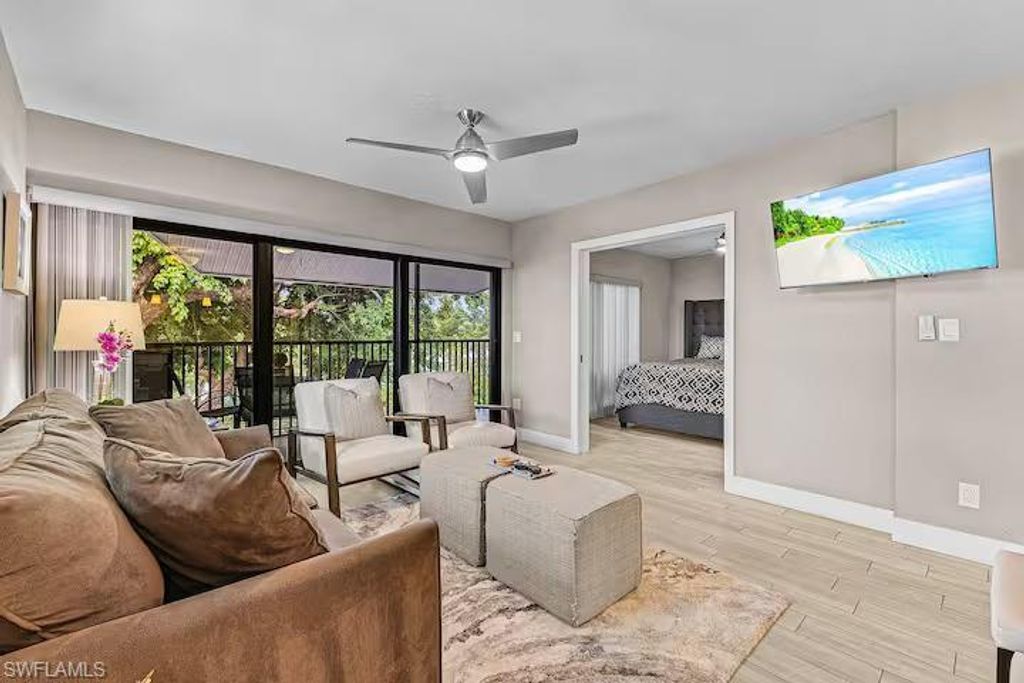
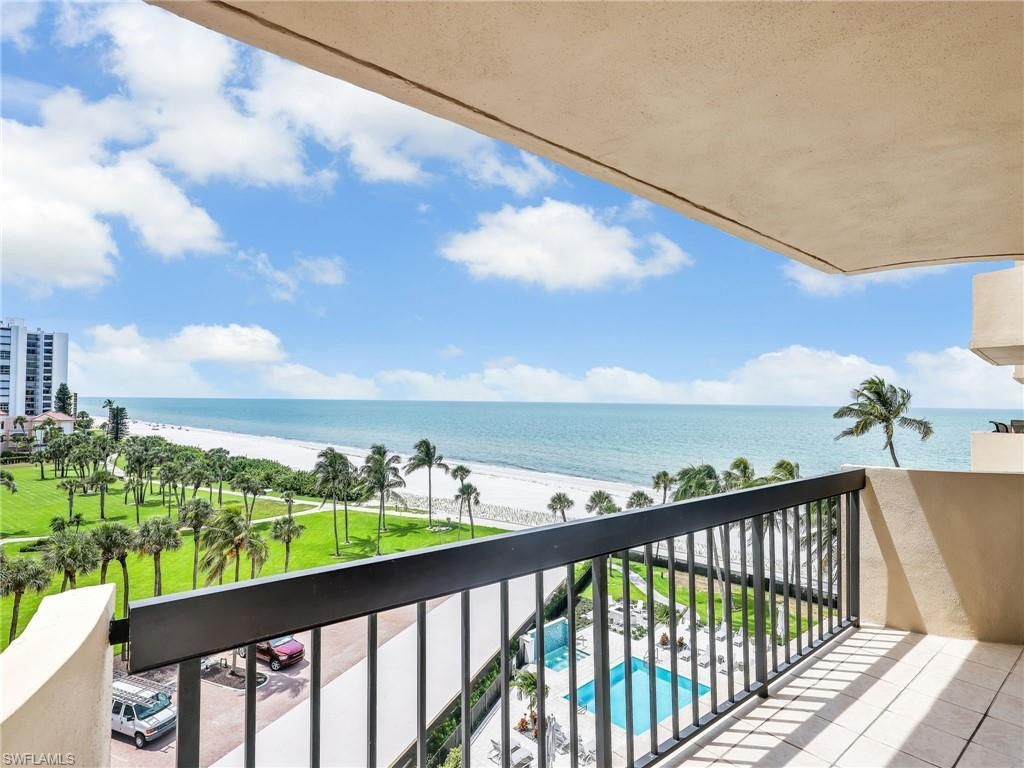
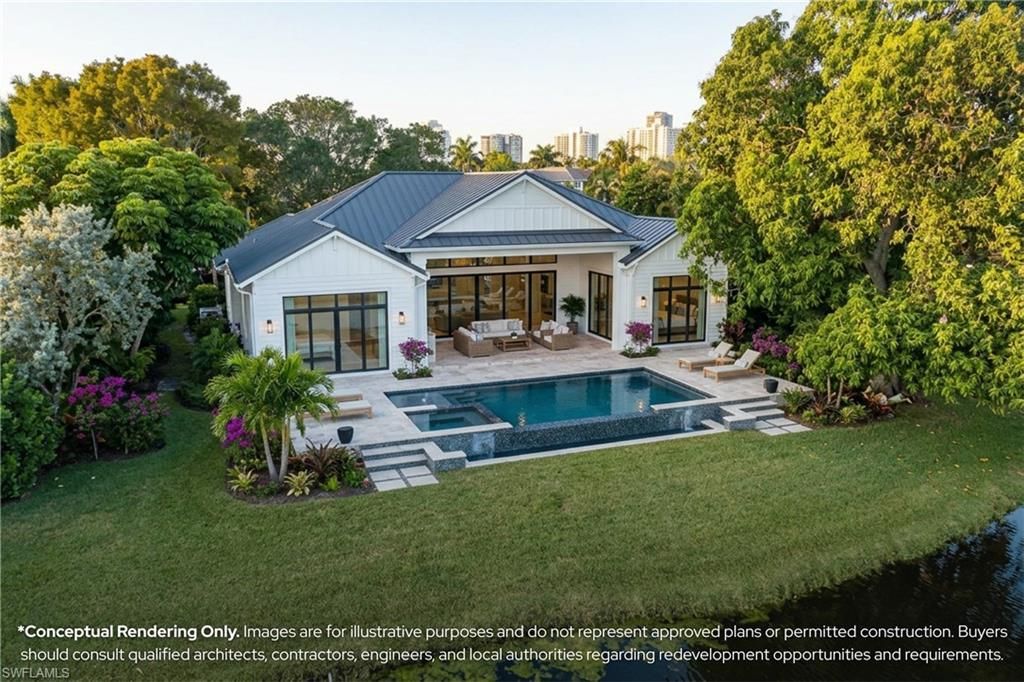
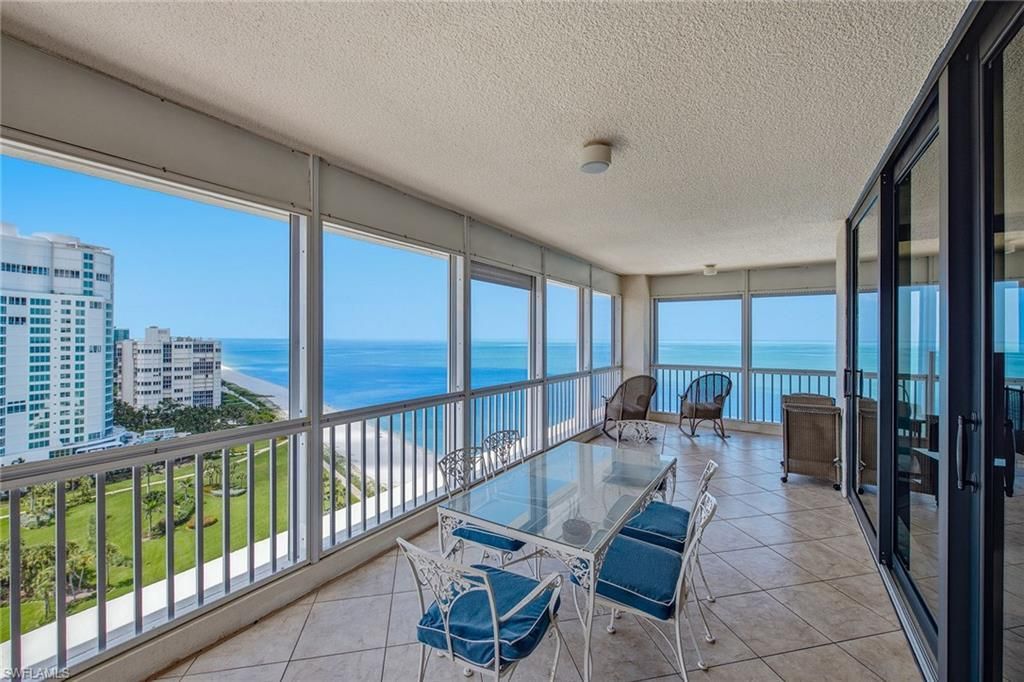
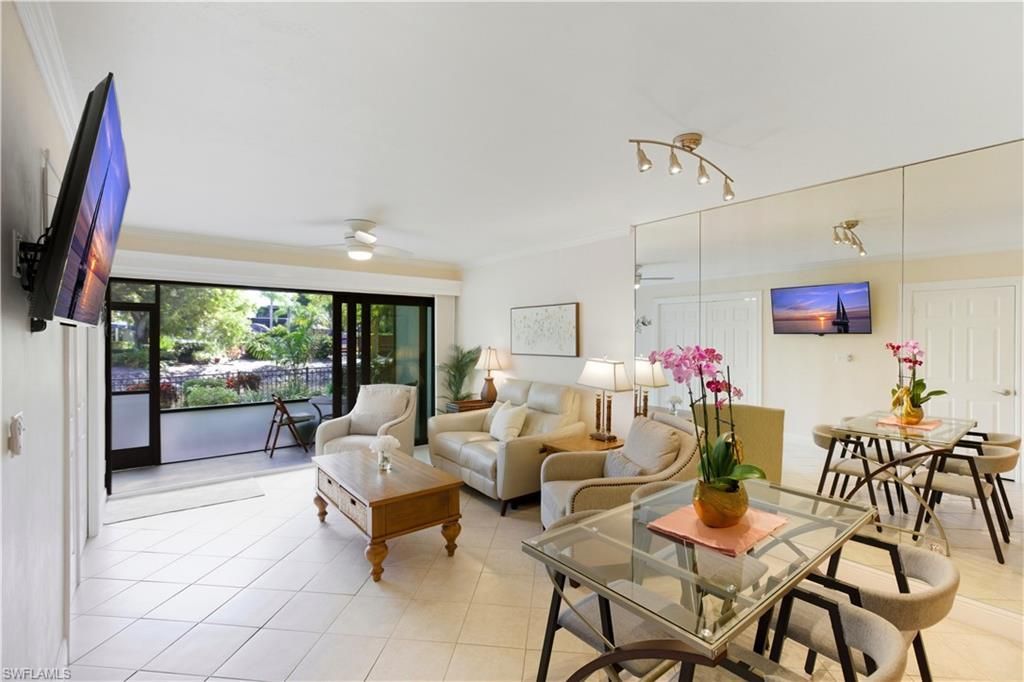
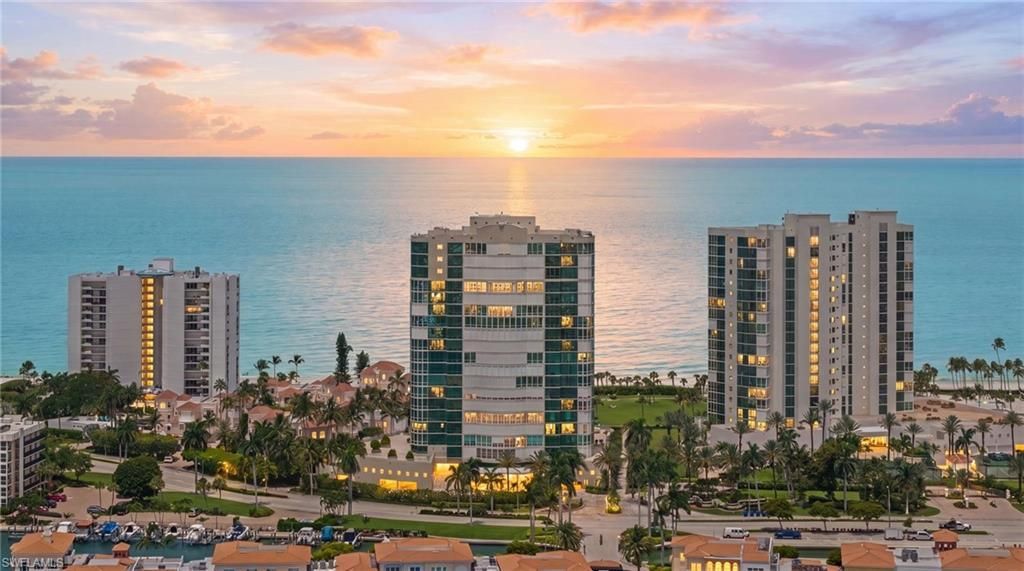
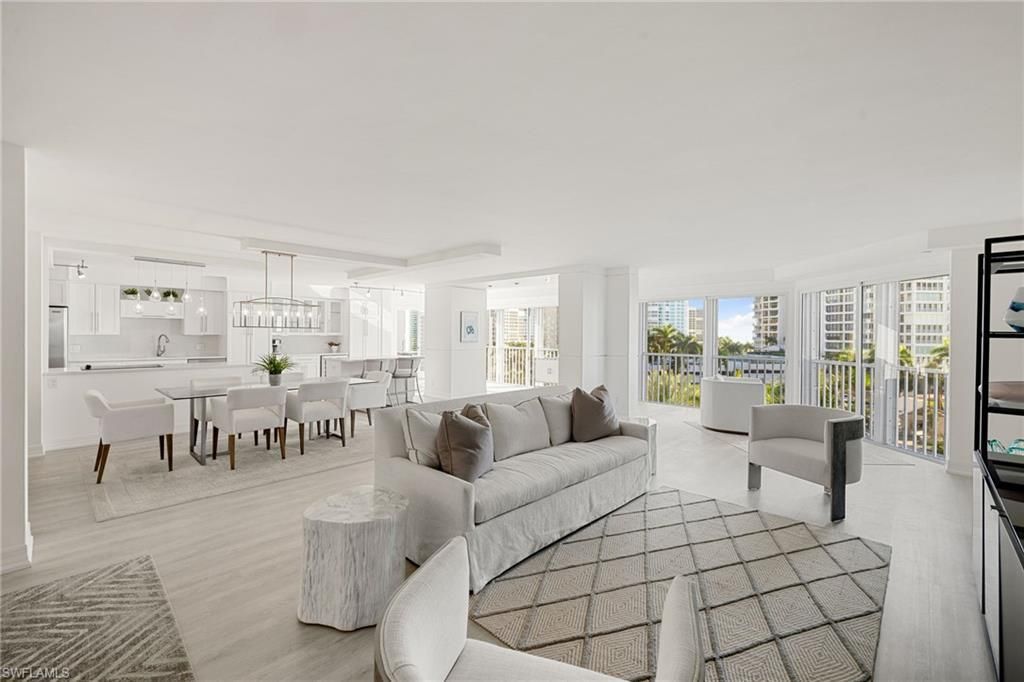
Park Shore - Recently Sold

What the High-Rise Numbers Really Say
The headline figure for the towers, a median of $902 per square foot against $1,090 a year earlier, overstates the change. Part of it is mix: 57% of this year’s tower sales were in buildings completed before 1990, against 50% the year before, and older towers trade for less per foot. Comparing like with like, across the 18 towers with at least two sales in each year, the typical building’s median price per foot is about 6% lower, and 13 of the 18 eased. Buyers were more active and a little more careful on price at the same time.
The top of the market tells a different story. The nine towers with the highest prices per foot, from Regent and Le Rivage through Park Plaza and Le Ciel Park Tower, have only seven residences listed between them on October 1, 2026. The other fifteen towers have 51. That imbalance is why tower listings, at a median asking price of $894 per square foot, are asking slightly less than buyers paid over the year: what remains for sale is weighted toward the older buildings.
Tower by Tower: The 24 Beachfront High-Rises
Every beachfront high-rise in Park Shore, ranked by median price per square foot over the last twelve months, with the prior year’s sales and the residences listed today:
| Tower | Sales | Median |
|---|---|---|
| Regent Built 2002 |
1 sale 0 prior year · 2 listed |
$26,000,000 $2,143 per sq ft |
| Le Rivage Built 1996 |
3 sales 2 prior year · 0 listed |
$10,200,000 $1,650 per sq ft |
| Le Jardin Built 1998 |
4 sales 2 prior year · 1 listed |
$6,225,000 $1,555 per sq ft |
| Enclave at Park Shore Built 1991 |
3 sales 0 prior year · 1 listed |
$8,750,000 $1,287 per sq ft |
| Aria Built 2006 |
1 sale 2 prior year · 1 listed |
$4,300,000 $1,267 per sq ft |
| Provence Built 2000 |
1 sale 5 prior year · 0 listed |
$4,075,000 $1,234 per sq ft |
| Le Parc Built 1990 |
6 sales 7 prior year · 1 listed |
$4,950,000 $1,222 per sq ft |
| Park Plaza Built 1984 |
3 sales 2 prior year · 1 listed |
$3,675,000 $1,175 per sq ft |
| Le Ciel Park Tower Built 1994 |
4 sales 4 prior year · 0 listed |
$3,550,500 $1,169 per sq ft |
| Meridian Club Built 1981 |
3 sales 3 prior year · 0 listed |
$2,412,500 $1,068 per sq ft |
| Vistas at Park Shore Built 1990 |
6 sales 8 prior year · 2 listed |
$1,785,000 $980 per sq ft |
| Le Ciel Venetian Tower Built 1994 |
6 sales 2 prior year · 0 listed |
$2,517,500 $966 per sq ft |
| La Mer Built 1978 |
10 sales 2 prior year · 3 listed |
$2,025,000 $930 per sq ft |
| Brittany Built 1995 |
13 sales 7 prior year · 5 listed |
$2,700,000 $918 per sq ft |
| Park Shore Tower Built 1985 |
5 sales 3 prior year · 2 listed |
$1,950,000 $857 per sq ft |
| Solamar Built 1986 |
5 sales 5 prior year · 3 listed |
$1,650,000 $804 per sq ft |
| Allegro Built 1981 |
5 sales 1 prior year · 4 listed |
$1,695,000 $781 per sq ft |
| Terraces at Park Shore Built 1986 |
4 sales 4 prior year · 3 listed |
$1,025,000 $781 per sq ft |
| Surfsedge Built 1974 |
7 sales 1 prior year · 5 listed |
$1,250,000 $761 per sq ft |
| Esplanade Club Built 1981 |
4 sales 5 prior year · 5 listed |
$1,300,000 $744 per sq ft |
| Savoy Built 1983 |
4 sales 6 prior year · 1 listed |
$1,322,500 $668 per sq ft |
| Gulfside Built 1974 |
2 sales 3 prior year · 7 listed |
$837,000 $659 per sq ft |
| Monaco Beach Club Built 1983 |
6 sales 2 prior year · 10 listed |
$1,737,500 $656 per sq ft |
| Horizon House Built 1972 |
6 sales 2 prior year · 1 listed |
$1,140,000 $579 per sq ft |
Twelve months to September 30, 2026. Medians from one or two sales describe those residences, not the whole building.
The year’s largest closing was a Regent penthouse at $26,000,000, or $2,143 per square foot, in February 2026, the highest Park Shore sale in the two years of data we reviewed. Le Rivage recorded three sales at $10,000,000 or more, including a private sale at $10,200,000 in September, and Le Parc two at $12,000,000 or more. Brittany was the most active tower, with 13 closings.
Bay-Side and Garden Condominiums
Away from the beach, Park Shore’s condominiums range from the Park Shore Resort’s compact residences to bayfront buildings with their own docks. The most active communities over the last twelve months:
| Community | Sales | Median |
|---|---|---|
| Park Shore Resort | 15 sales 13 prior year · 6 listed |
$316,000 $366 per sq ft |
| Colonade | 11 sales 5 prior year · 4 listed |
$1,250,000 $574 per sq ft |
| Hidden Lake Villas | 10 sales 12 prior year · 5 listed |
$372,500 $369 per sq ft |
| Swan Lake Club | 6 sales 1 prior year · 1 listed |
$500,000 $372 per sq ft |
| Pelican Point | 5 sales 7 prior year · 1 listed |
$649,000 $618 per sq ft |
| Venetian Villas | 4 sales 1 prior year · 2 listed |
$2,322,500 $1,084 per sq ft |
| Colony Gardens | 4 sales 0 prior year · 2 listed |
$2,050,000 $1,000 per sq ft |
| Bay Shore Place | 4 sales 1 prior year · 1 listed |
$1,750,000 $1,105 per sq ft |
The segment’s median sale rose to $835,000 from $575,000, mostly because more of the year’s sales were larger residences, at Colonade in particular. Price per square foot rose a more modest 8%, to $503.
Single-Family Homes
| Homes | Sales | Median |
|---|---|---|
| Waterfront homes 8 listed |
9 4 prior year |
$8,600,000 $1,632 per sq ft |
| Other homes 17 listed |
43 26 prior year |
$3,550,000 $1,150 per sq ft |
Fifty-two homes closed, against 30 the year before, at a median of $4,890,000. Waterfront position is the dividing line: the nine homes on the bay or a canal sold at a median of $8,600,000 and $1,632 per square foot, against $3,550,000 and $1,150 for the rest. The year’s top home sales were the same bayfront residence on Neapolitan Way, which closed at $14,500,000 in April 2026 and again at $14,500,000 on September 30. For the streets, docks and bridge clearances behind these numbers, see Park Shore waterfront homes.
What September Closed
Sixteen sales, against eleven in September 2025, four of them on the last day of the month. At the top, a bayfront home on Neapolitan Way closed at $14,500,000, 94% of its $15,500,000 asking price after 29 days on the market, five and a half months after it last sold at the same price. A Le Rivage residence changed hands privately at $10,200,000, a home on Pine Grove Lane closed at $4,880,000 after six days on the market, at 93% of its asking price, and a Park Plaza residence closed at $3,200,000. At the other end, the month showed how the market treats ambitious pricing: a Surfsedge residence closed at 70% of its original asking price after 303 days, and a Terraces at Park Shore residence at 84% after 251, while a Monaco Beach Club residence that had been on the market for 292 days closed at 96% of its original price.
The Gap Between Asking and Achieved
Median asking price per square foot for the residences offered on October 1, 2026, against the median buyers paid over the last twelve months:
| Segment | Asking | Paid |
|---|---|---|
| Beachfront towers | $894 58 listings |
$902 112 sales |
| Other condominiums | $541 38 listings |
$503 97 sales |
| Single-family homes | $1,432 25 listings |
$1,255 52 sales |
| All Park Shore | $869 121 listings |
$823 261 sales |
The single-family homes carry the widest gap: sellers are asking about 14% more per foot than buyers have paid. The other condominiums ask about 8% more. In the towers the comparison runs the other way because the listings are weighted toward older buildings, so judge any tower asking price against sales in that building, in the table above.
When Park Shore Actually Trades
Closings by month over the last year: 8 in October, 15 in November, 22 in December, 18 in January, 18 in February, 40 in March, 36 in April, 35 in May, 20 in June, 16 in July, 17 in August and 16 in September. The three spring months carried 111 of the year’s 261 sales, or 43%, which is why a listing prepared in the autumn and launched in the first weeks of the year meets the largest pool of buyers.
What We Mean by Towers, Condominiums and Homes
These groupings are ours, not MLS fields, so here is exactly how the residences are counted. Beachfront towers: the 24 high-rises on the Gulf side of Gulf Shore Boulevard North listed above, from Horizon House, the first, to Aria, the newest; our guide to Park Shore condo buildings compares them side by side. Other condominiums: every other condominium, villa and townhome in the MLS Park Shore development, including the bay-side buildings, garden communities and the Park Shore Resort. Single-family homes: detached homes, with waterfront homes those the MLS describes as fronting the bay, a canal or a seawall; lakefront homes are counted with the rest. Thirteen private sales recorded in the MLS after closing are included in the prices and excluded from days on market.
What This Means If You Are Selling
Price against what closed in your building or on your street, not against the listings around you. In the upper-tier towers, where only seven residences are for sale, a well-presented listing has very little competition. In the older towers the opposite is true: Gulfside has seven residences listed against two sales in the year, and Monaco Beach Club ten against six, so the first price has to be right. For a private valuation built from your building’s own sales, see Selling in Park Shore, or compare this report with the Naples waterfront market report.
Park Shore Condominium Communities
More About Park Shore
Park Shore Market Questions
Is Park Shore a buyer’s or a seller’s market?
What is the median price in Park Shore?
Are Park Shore high-rise condo prices falling?
Which Park Shore high-rise sells for the most per square foot?
How often is this Park Shore market report updated?
Can you prepare a market report for my building?
Data source: Naples Area Board of REALTORS® MLS data for the Park Shore development, compiled by Alpizar & Company. Inventory as of October 1, 2026; closed sales October 1, 2025 through September 30, 2026, compared with October 1, 2024 through September 30, 2025. Figures are medians unless stated and are deemed reliable but not guaranteed.
Meet the Team
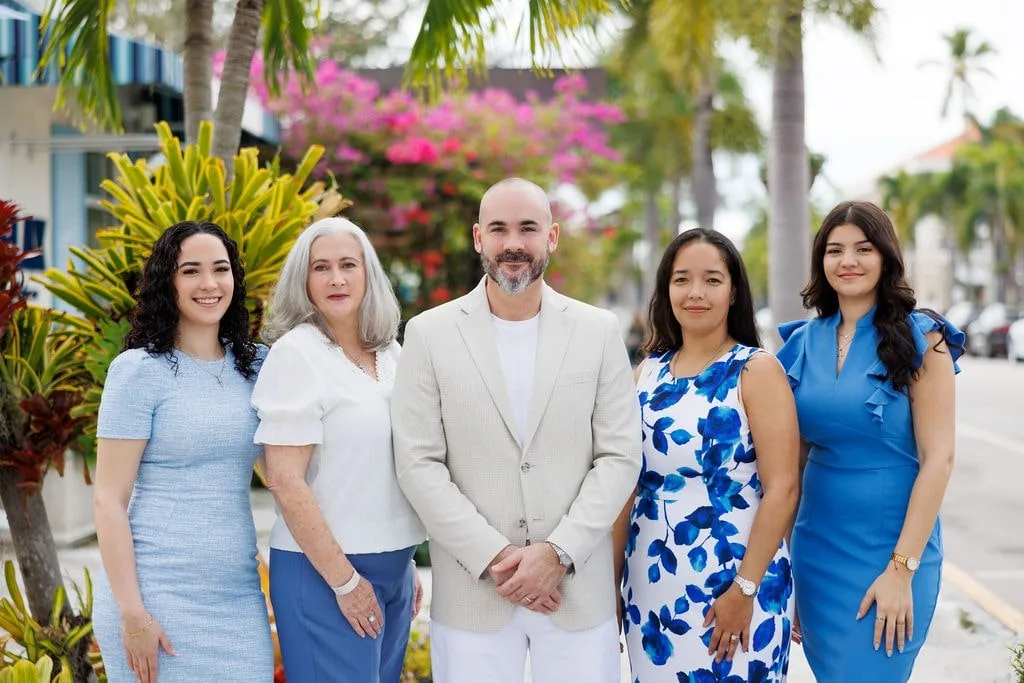
Connect with Real Estate Advisors... not Salespeople.
Alpizar & Company is a family-owned independent brokerage specializing in luxury waterfront real estate across Naples' most sought-after neighborhoods. Led by Robert Alpizar (CLHMS, GRI, SRS, PSA) and Marlene Alpizar, our team operates as advisors — not salespeople — guiding buyers and sellers with firsthand local expertise and no corporate quotas.
We offer complimentary, pressure-free consultations without any commitment.
How can we Help?
Over 250 closed transactions. $100 million in Naples luxury waterfront sales. Read what our buyers and sellers say about working with an advisor-driven independent brokerage — and why they come back.
What's it like working with Alpizar & Company?