
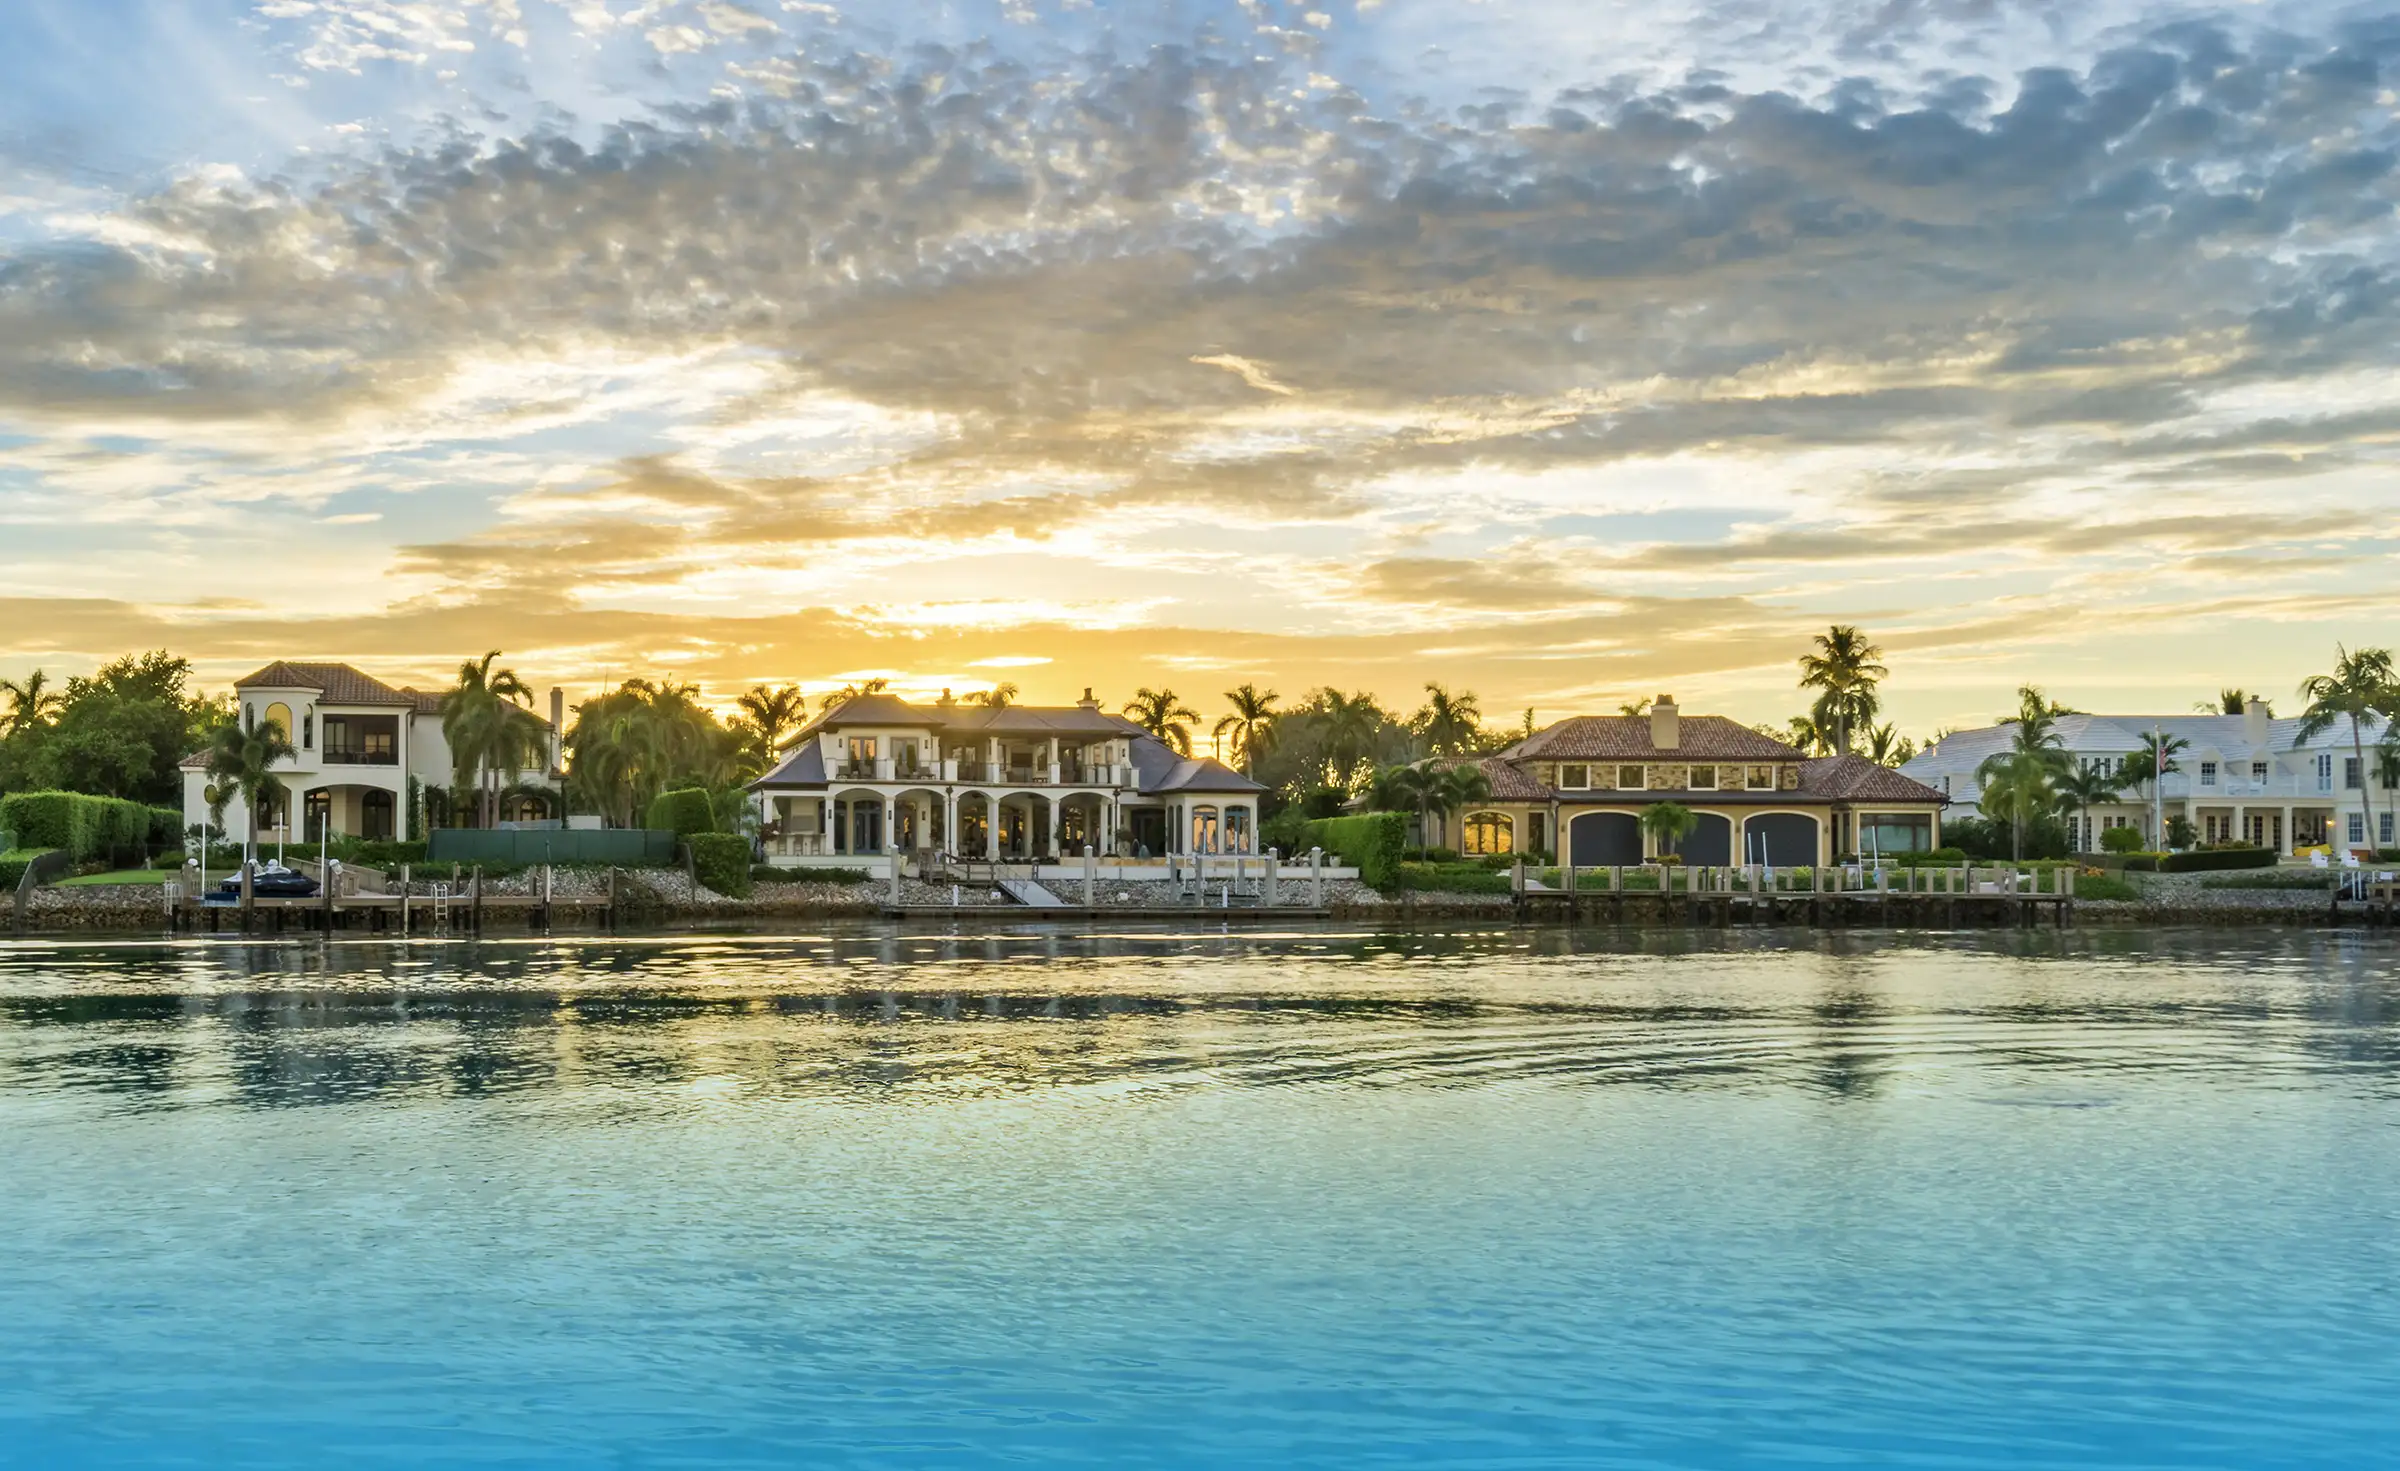
Naples waterfront sales rose 37% over the year to $2.97 billion, and more than four in five buyers paid cash.
Every month we pull every salt-water home and condominium in Naples from the MLS, on the Gulf and the beach, on Naples Bay and the rivers, on the Gulf-access canals and in the Gulf-view towers, and publish the results here in full: inventory, months of supply, price per square foot, what closed and what did not. Lakes, ponds and freshwater canals are left out. For a single neighborhood, follow the links in the table below to its own report.
September 2026 — Inventory
| Segment | Listed | Supply |
|---|---|---|
| Gulf-front and beachfront | 135 active 8 pending |
5.7 months |
| Bay and river frontage | 195 active 39 pending |
7.8 months |
| Gulf-access canals | 145 active 16 pending |
8.5 months |
| Gulf-view towers | 70 active 16 pending |
6.9 months |
| All Naples waterfront | 545 active 79 pending |
7.2 months |
Months of supply compares the properties offered today with the pace of sales over the last twelve months. Across the Naples waterfront there are about seven months of supply, a balanced market. Gulf-front and beachfront property is the tightest, at under six months, and the Gulf-access canals carry the most, at about eight and a half.
Twelve-Month Performance
| Segment | Sales | Per Sq Ft |
|---|---|---|
| Gulf-front and beachfront Median $1,970,000 |
285 212 prior year |
$944 $1,021 prior year |
| Bay and river frontage Median $1,141,250 |
300 238 prior year |
$692 $788 prior year |
| Gulf-access canals Median $1,070,000 |
204 132 prior year |
$568 $730 prior year |
| Gulf-view towers Median $1,875,000 |
122 83 prior year |
$752 $745 prior year |
| All Naples waterfront Median $1,600,000 |
911 665 prior year |
$804 $863 prior year |
Nine hundred eleven waterfront homes and condominiums closed over the twelve months to September 30, 2026 for $2.97 billion, against 665 for $2.44 billion the year before: 37% more sales and 22% more dollars. Every kind of water sold more, the canals 55% more and the Gulf-view towers 47% more. Prices per foot eased, to a median $804 from $863, about 7% lower; on the canals the median fell to $568 from $730, partly because more of the year’s canal sales were smaller homes in communities such as Port of the Islands. The median sale closed at 89% of its original asking price, against 88% the year before, and 93% of its final one, after a median of 98 days on the market, up from 86.
Houses and condominiums moved differently. Two hundred twenty waterfront houses closed at a median $3,262,500 and $1,114 a square foot, against 166 at $4,230,000 and $1,304 the year before, while 691 condominiums closed at a median $1,420,000 and $746 a foot, against 499 at $1,400,000 and $789. Sixty sales were at $10 million or more, together $1.2 billion, about two-fifths of the year’s dollars. The year’s highest price was $62,500,000, for 20 14th Avenue South in Olde Naples in September 2026, ahead of $55,000,000 for 4296 Cutlass Lane in Port Royal in January.
Inventory as of October 1, 2026. Sales, medians, price per square foot, days on market and percentage of asking price reflect the 911 waterfront sales closed between October 1, 2025 and September 30, 2026, against the 665 closed in the twelve months before. Source: Naples Area Board of REALTORS® MLS.
What September Closed
Sixty-four waterfront sales, against 44 in September 2025, for $311.5 million at a median $1,650,000: 14 on the Gulf or the beach, 21 on the bay or a river, 16 on Gulf-access canals and 13 in the Gulf-view towers. The largest:
| 20 14th Avenue South | Olde Naples, Gulf-front home — $62,500,000, 4,822 sq ft on a Gulf-front estate lot, 688 days on market, 63% of its original $99,000,000 asking price and 70% of its final $89,000,000 |
| 1207 Spyglass Lane | Port Royal, bay-front home sold under construction — $36,000,000, 9,059 sq ft, $3,974 per sq ft, 140 days on market, at its full asking price |
| 3525 Fort Charles Drive | Port Royal, bay-front home — $26,000,000, 7,751 sq ft, $3,354 per sq ft, 62 days on market, 93% of its $28,000,000 asking price |
| Seasons at Naples Cay, Penthouse 20 | Naples Cay, Gulf-view penthouse — $21,500,000, 12,933 sq ft, $1,662 per sq ft, 166 days on market, 86% of its $24,990,000 asking price |
| 1707 3rd Street South | Aqualane Shores, new canal-front home — $19,500,000, 7,412 sq ft, $2,631 per sq ft, 93 days on market, 89% of its $21,995,000 asking price |
| Naples Beach Club, Residence A402 | Naples Beach Club, new Gulf-front residence — $16,000,000, 5,337 sq ft, $2,998 per sq ft, recorded after closing at its full price |
| 405 Neapolitan Way | Park Shore, bay-front home — $14,500,000, 7,115 sq ft, $2,038 per sq ft, 29 days on market, 94% of its $15,500,000 asking price |
| 3125 Leeward Lane | The Moorings, bay-front home — $12,000,000, 6,286 sq ft, $1,909 per sq ft, 111 days on market, 98% of its $12,300,000 asking price |
Against those 64 closings, 90 waterfront listings left the market unsold in September, terminated, withdrawn or expired, 35 of them on the bay or a river, among them a Fort Charles Drive estate withdrawn at $32,500,000 and a Spyglass Lane home terminated at $18,900,000. On October 1, 79 waterfront properties were under contract.
How Waterfront Buyers Pay
Cash dominates. Eighty-two percent of the year’s waterfront buyers paid cash, against 77% the year before, and above $3 million the figure was 90%. Sellers paid a concession, a credit to the buyer at closing, in 57 of the 911 sales, about one in sixteen. Buyers recorded as resident in the United States accounted for 857 of the 911 sales; Canada, with six, was the most frequent foreign country recorded.
The Gap Between Asking and Achieved
Median asking price per square foot for the waterfront properties offered on October 1, 2026, against the median buyers paid over the last twelve months:
| Segment | Asking | Paid |
|---|---|---|
| Gulf-front and beachfront | $1,028 135 listings |
$944 285 sales |
| Bay and river frontage | $836 195 listings |
$692 300 sales |
| Gulf-access canals | $924 145 listings |
$568 204 sales |
| Gulf-view towers | $779 70 listings |
$752 122 sales |
| All Naples waterfront | $927 545 listings |
$804 911 sales |
Across the waterfront, sellers are asking about 15% more per foot than buyers have paid. The Gulf-front and the Gulf-view towers are closest to the market, at 9% and 4%, and bay and river frontage asks about a fifth more. The canal figure, about 63%, reflects what is for sale more than a change in value: a quarter of the canal listings are in Aqualane Shores and Royal Harbor, where canal prices per foot are among the highest in Naples, while the year’s canal sales included 31 at Port of the Islands, where they are the lowest. Judge any canal-front ask against sales on the same water.
Neighborhood by Neighborhood
Every Naples waterfront neighborhood with a sale in the last twelve months, ranked by dollar volume. These figures count waterfront sales only; each neighborhood’s own report, linked here, covers every sale, on the water and off it.
| Area | Sales | Median |
|---|---|---|
| Port Royal 15 listed |
25 sales 25 prior year |
$19,950,000 $3,160 per sq ft |
| Park Shore 75 listed |
152 sales 104 prior year |
$2,000,000 $913 per sq ft |
| The Moorings 66 listed |
142 sales 99 prior year |
$1,175,000 $777 per sq ft |
| Vanderbilt Beach 55 listed |
114 sales 82 prior year |
$1,180,000 $749 per sq ft |
| Aqualane Shores 22 listed |
23 sales 20 prior year |
$8,400,000 $1,753 per sq ft |
| Pelican Bay 32 listed |
86 sales 76 prior year |
$1,875,000 $824 per sq ft |
| Bay Colony 9 listed |
33 sales 34 prior year |
$4,350,000 $1,366 per sq ft |
| Olde Naples 15 listed |
9 sales 10 prior year |
$1,450,000 $867 per sq ft |
| Royal Harbor 21 listed |
25 sales 17 prior year |
$2,900,000 $1,131 per sq ft |
| Kalea Bay 12 listed |
21 sales 12 prior year |
$3,955,000 $1,202 per sq ft |
| Naples Beach Club 2 listed |
5 sales 0 prior year |
$16,000,000 $2,998 per sq ft |
| The Dunes 11 listed |
29 sales 16 prior year |
$1,875,000 $626 per sq ft |
| Naples Cay 5 listed |
9 sales 4 prior year |
$3,950,000 $1,176 per sq ft |
| Pelican Isle 12 listed |
12 sales 7 prior year |
$2,018,750 $654 per sq ft |
| Isles of Capri 28 listed |
26 sales 28 prior year |
$900,000 $440 per sq ft |
| Coquina Sands 19 listed |
14 sales 4 prior year |
$1,517,500 $855 per sq ft |
| Mangrove Bay 0 listed |
5 sales 2 prior year |
$4,750,000 $1,267 per sq ft |
| Port of the Islands 21 listed |
35 sales 17 prior year |
$415,000 $291 per sq ft |
| Naples Bay Resort 2 listed |
5 sales 1 prior year |
$2,600,000 $852 per sq ft |
| Cove Towers 13 listed |
9 sales 11 prior year |
$1,100,000 $531 per sq ft |
| Oyster Bay 16 listed |
12 sales 12 prior year |
$482,500 $352 per sq ft |
| Seagate 4 listed |
2 sales 3 prior year |
$2,849,500 $898 per sq ft |
| Windstar 1 listed |
4 sales 3 prior year |
$1,350,000 $474 per sq ft |
| Hammock Bay 13 listed |
8 sales 8 prior year |
$670,000 $282 per sq ft |
| Bayfront 5 listed |
4 sales 12 prior year |
$835,000 $568 per sq ft |
| Gulf Harbor 6 listed |
3 sales 2 prior year |
$962,500 $631 per sq ft |
| Wiggins Bay 1 listed |
2 sales 6 prior year |
$345,000 $260 per sq ft |
| Other Naples waterfront 64 listed |
97 sales 50 prior year |
$665,000 $480 per sq ft |
Twelve months to September 30, 2026. Bay Colony is shown apart from the rest of Pelican Bay. Medians from a handful of sales describe those properties, not the whole neighborhood.
When the Naples Waterfront Actually Trades
Closings by month over the last year: 54 in October, 42 in November, 71 in December, 61 in January, 92 in February, 116 in March, 129 in April, 108 in May, 74 in June, 55 in July, 45 in August and 64 in September. March through May carried 353 of the year’s 911 sales, or 39%, and because a closing follows its contract by thirty to sixty days, those reflect contracts signed from late winter into spring. September’s 64 were the most in any month since June.
What We Count as Naples Waterfront
Every residential property in the City of Naples on salt water, by our own reading of the MLS record rather than the MLS waterfront flag alone, which mislabels properties in both directions. Gulf-front and beachfront: frontage on the Gulf or the beach. Bay and river frontage: Naples Bay, Venetian Bay, Vanderbilt and Wiggins Bay, Gordon Pass and the tidal rivers. Gulf-access canals: canal and basin frontage with boat access to the Gulf. Gulf-view towers: condominiums that look over the Gulf or the bay without fronting it, as in much of Pelican Bay and The Dunes. Lakes, ponds, golf-course water and freshwater canals are excluded, as are homes whose Gulf access is shared through the community rather than at the property. Private sales recorded in the MLS after closing are included in the prices and excluded from days on market. For what to look for on each kind of water, see our guide to buying waterfront property in Naples.
Waterfront Condominiums and Florida’s Safety Law
Most Naples waterfront sales are condominiums, and the condition of the building now weighs on the price of every residence in it. Florida’s condominium safety law requires buildings of three stories or more to complete a milestone structural inspection at 30 years (25 where the local building official requires it) and every 10 years after, and a structural integrity reserve study every 10 years, the first of which was due by December 31, 2025. Every waterfront tower completed in 1996 or earlier has passed the 30-year mark, so the milestone inspection report, the structural integrity reserve study, the budget and any pending assessments belong in the comparison alongside price per square foot. Resale buyers have seven days after receiving the condominium documents to cancel.
What This Means If You Are Selling
Price against what closed on your kind of water, in your neighborhood. The waterfront median per foot runs from $568 on the canals to $944 on the Gulf, and from $291 at Port of the Islands to $3,160 in Port Royal, so a market-wide average tells a seller very little. Four in five buyers pay cash, which shortens the path from contract to closing but does not soften the negotiation: the median sale closed at 89% of its first asking price. We prepare a confidential valuation from the sales that genuinely compare to your property; see selling a waterfront home in Naples.
Naples Waterfront - Recent Sales
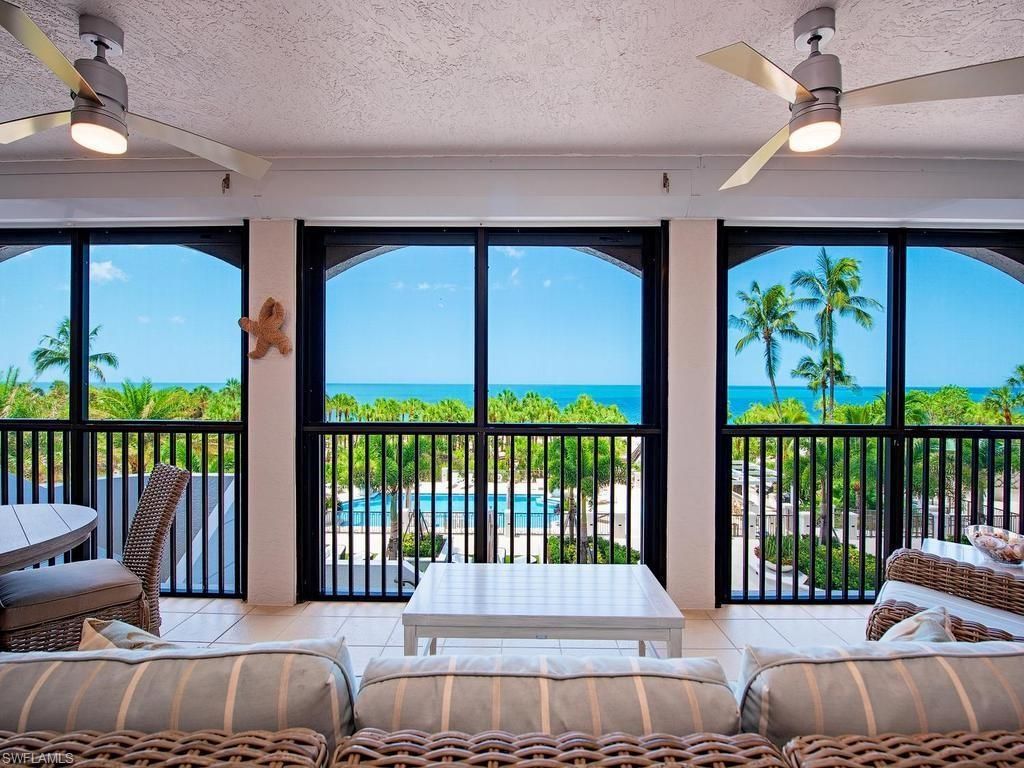

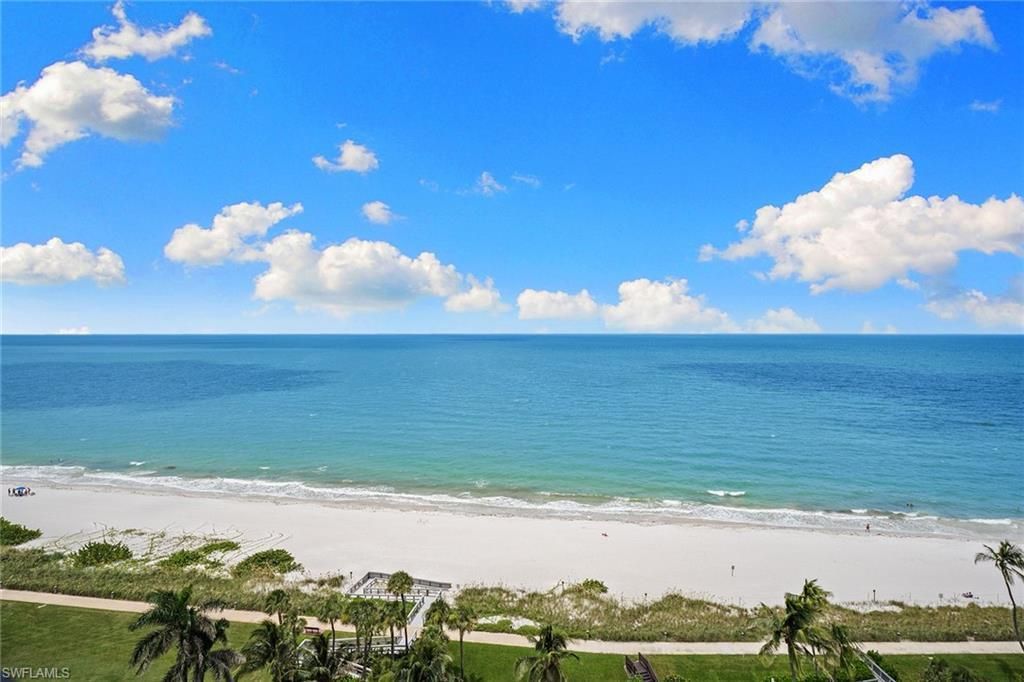
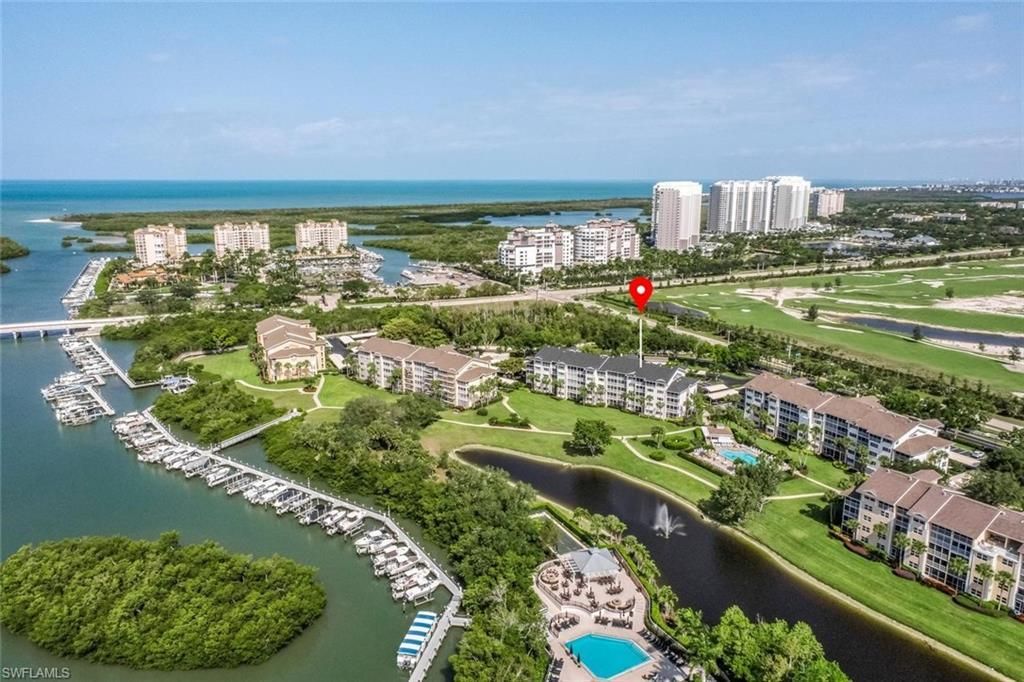
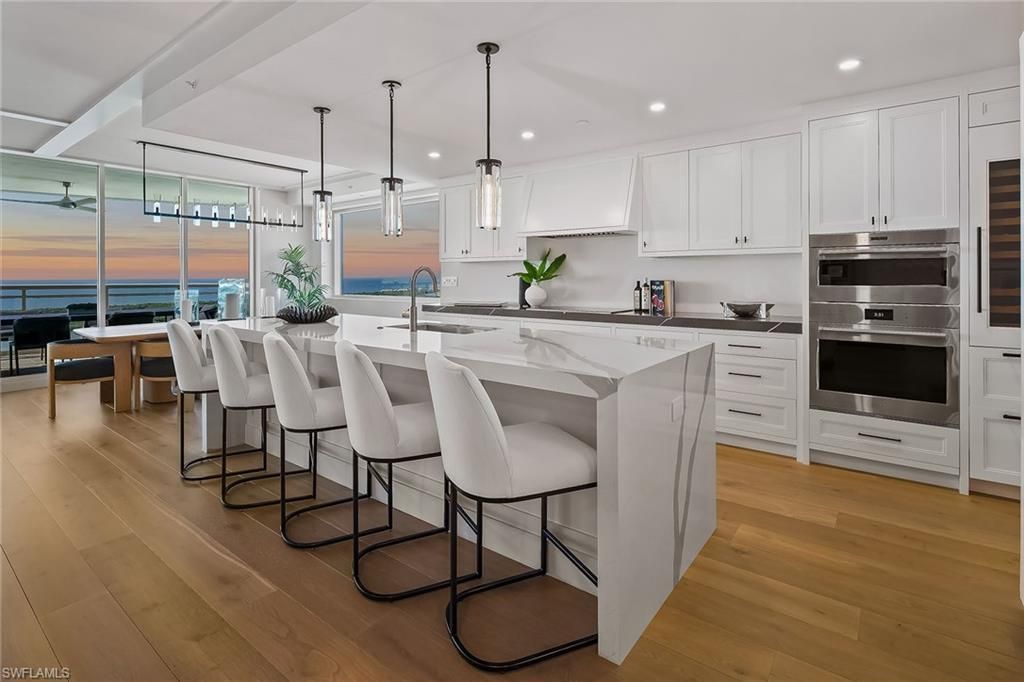
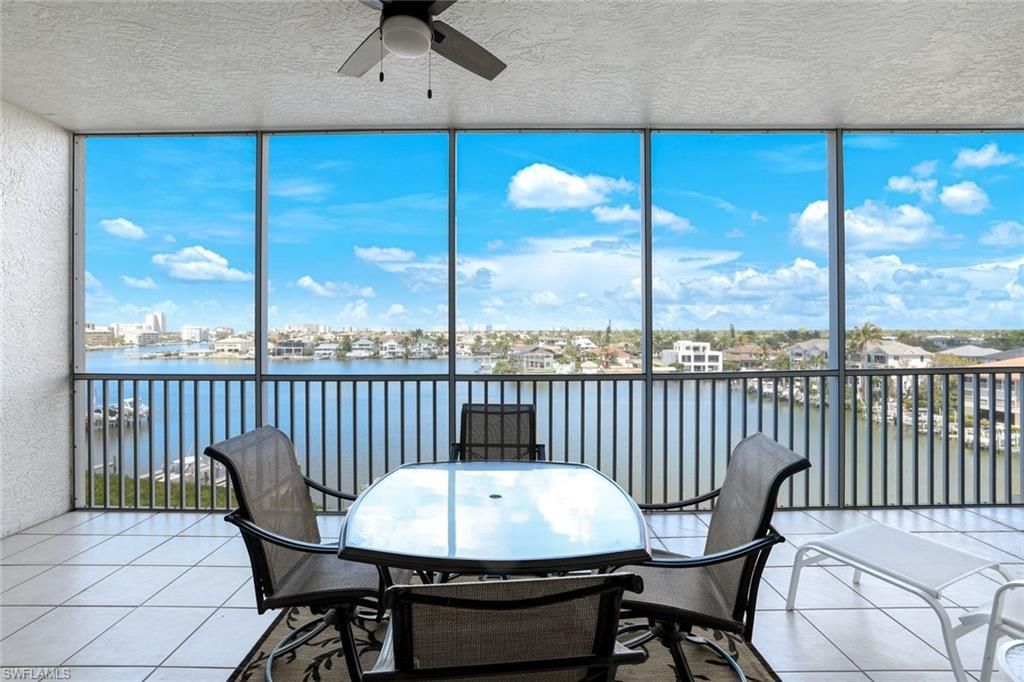
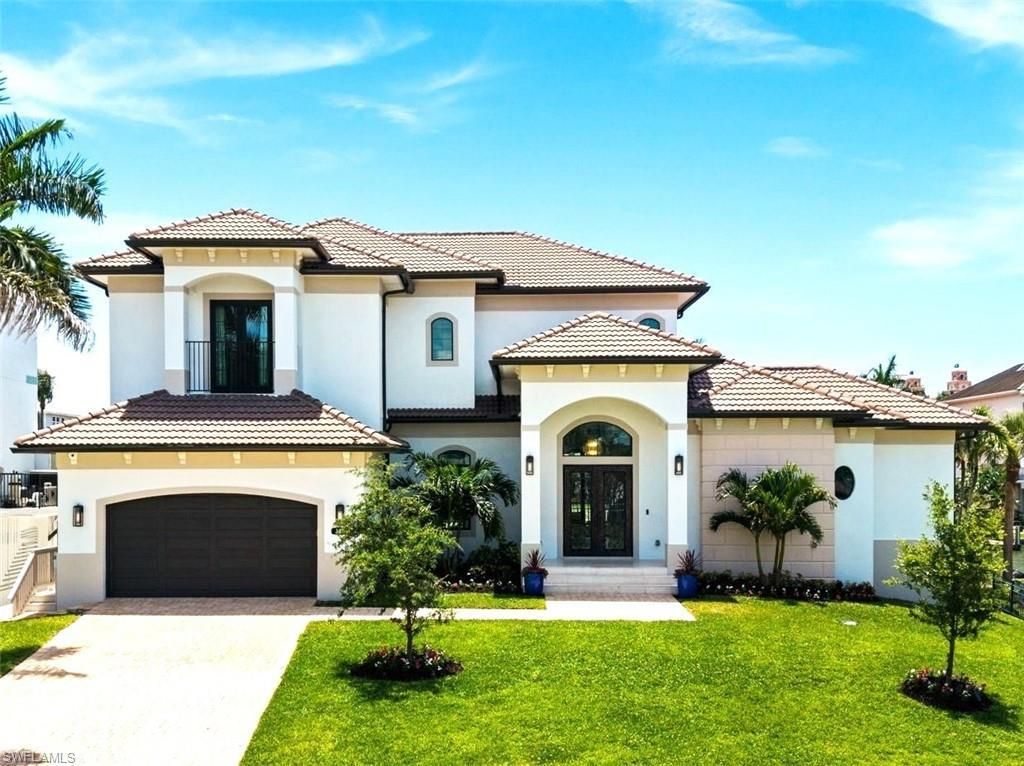
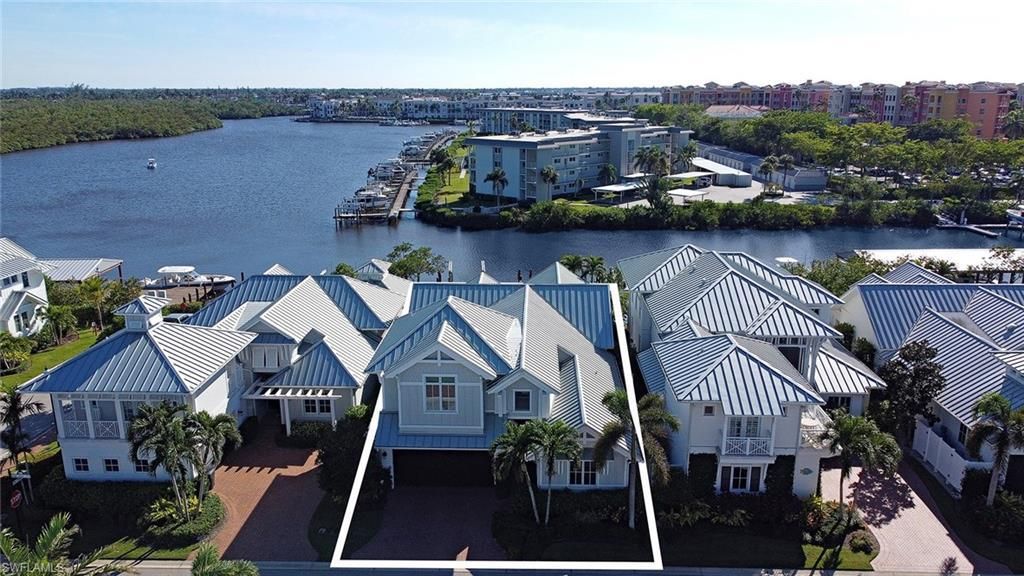
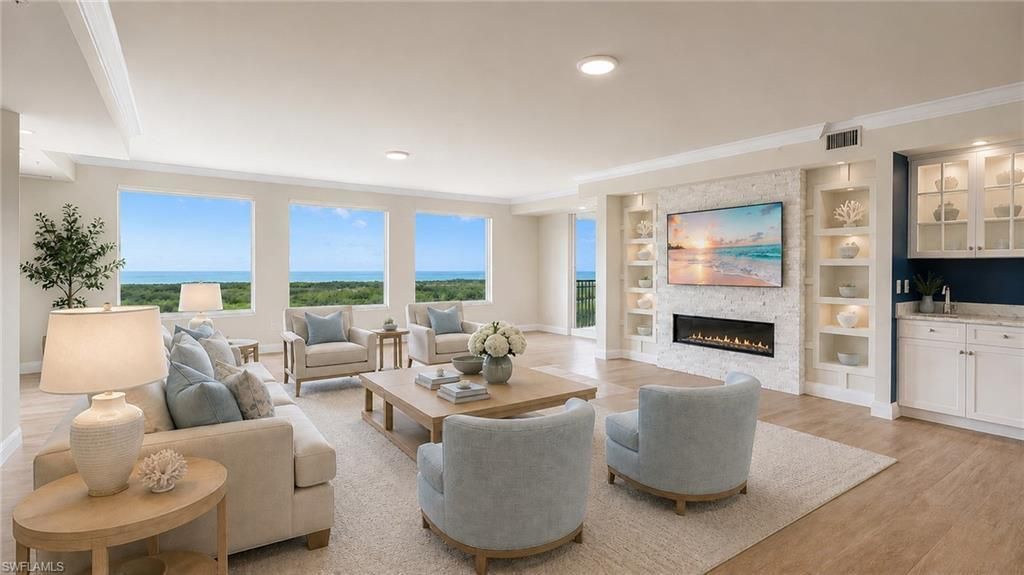
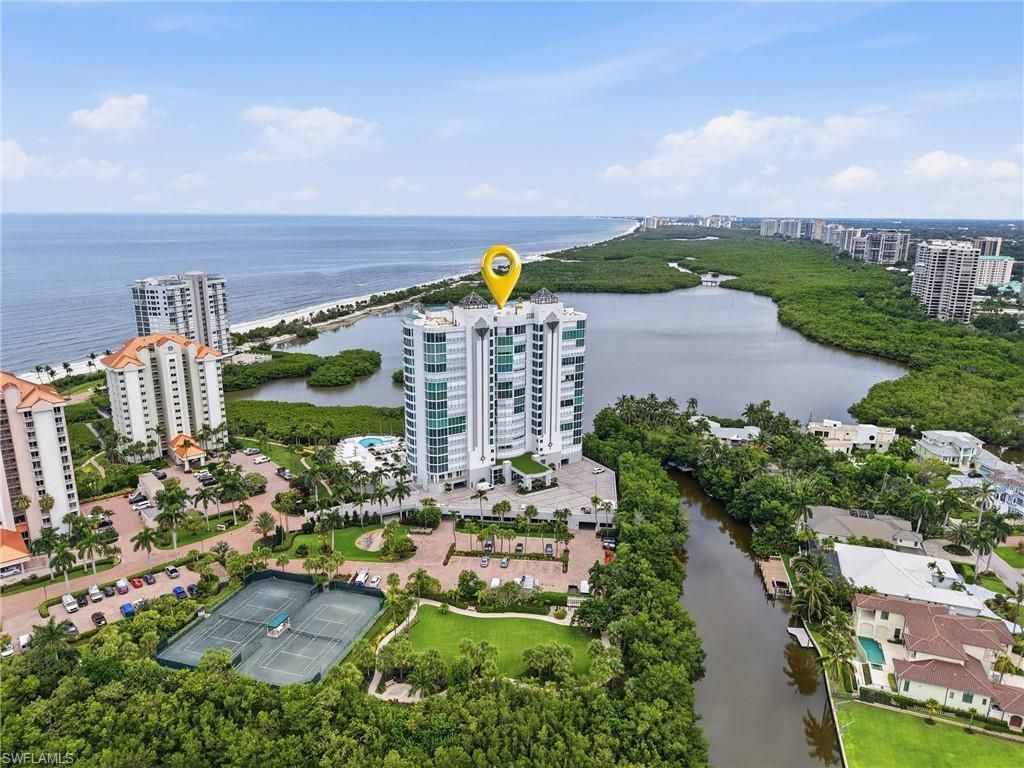
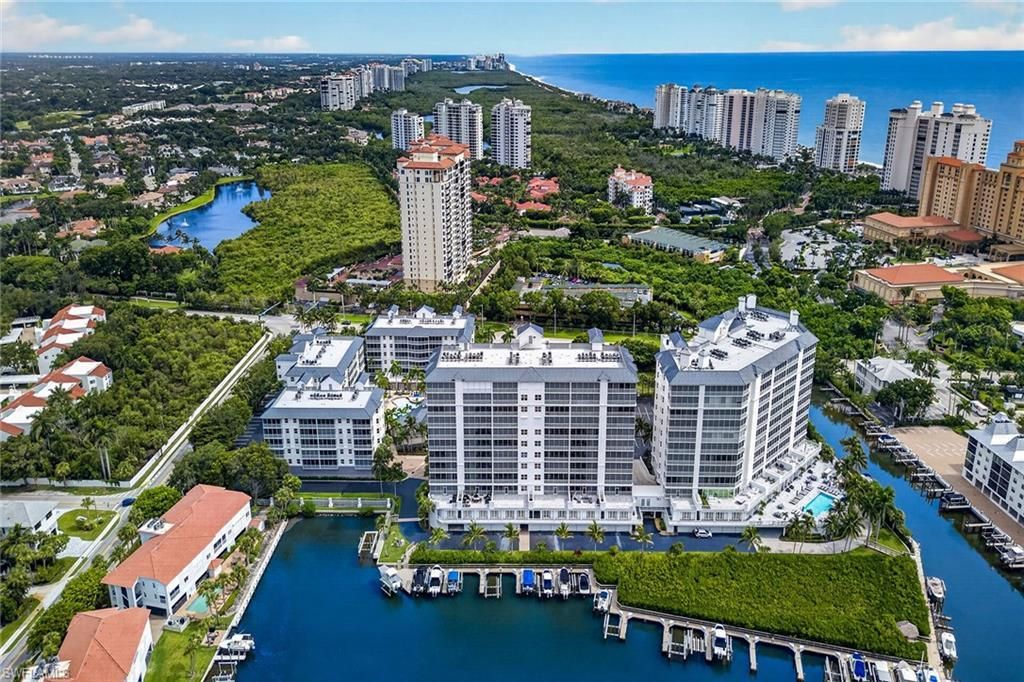
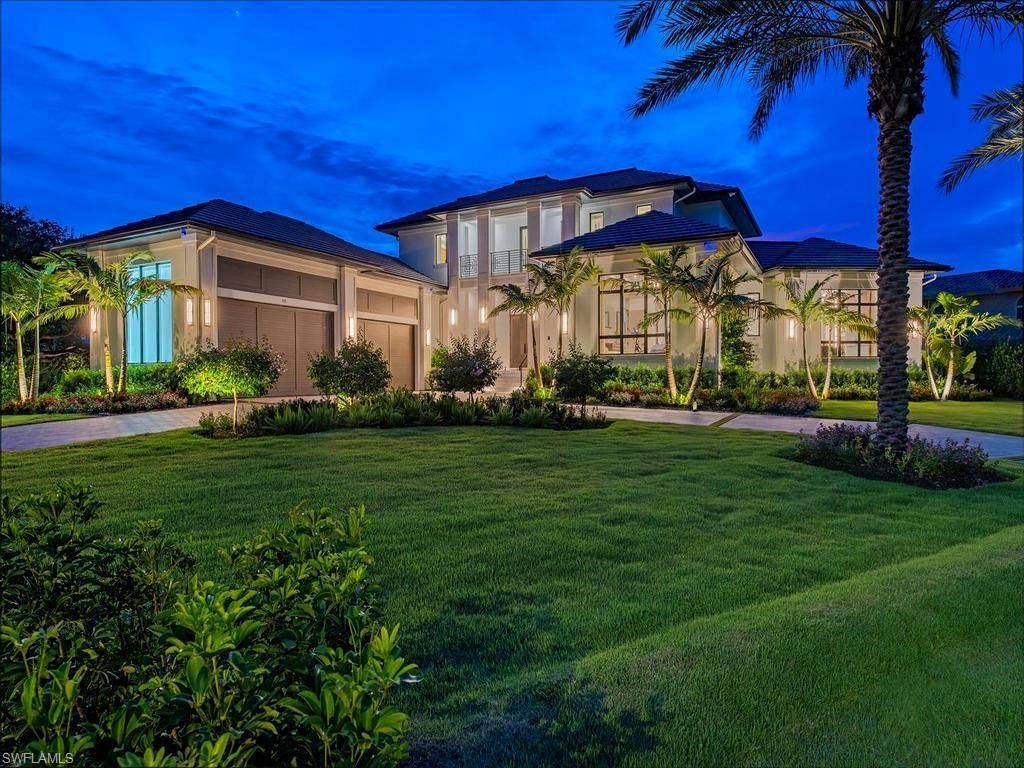
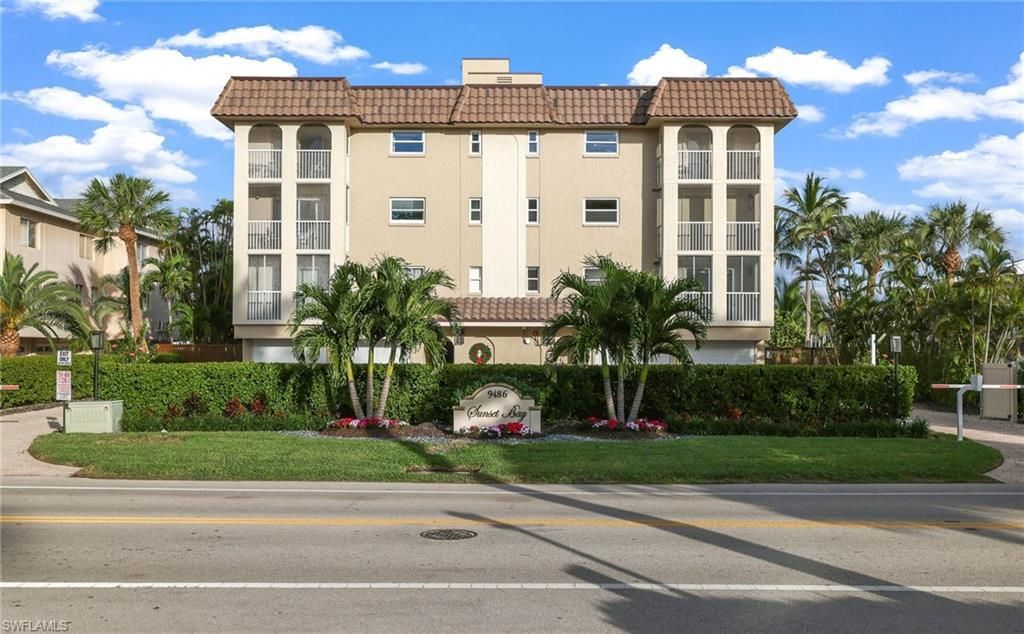
Naples market reports, updated monthly: closed sales, median prices, months of supply and price per square foot for every Naples waterfront neighborhood in the Naples Waterfront Market Report, with the month’s highlights in our September 2026 waterfront roundup.
By neighborhood: Aqualane Shores · Bay Colony · Coquina Sands · Isles of Capri · Kalea Bay · The Moorings · Naples Cay · Olde Naples · Oyster Bay · Park Shore · Pelican Bay · Port of the Islands · Port Royal · Royal Harbor · The Dunes · Vanderbilt Beach
Naples Waterfront by Category
More for Naples Waterfront Buyers
Naples Waterfront Market Questions
Is the Naples waterfront a buyer’s or a seller’s market?
Balanced. On October 1, 2026 there were 545 salt-water homes and condominiums listed in Naples against 911 sales over the previous twelve months, about seven months of supply. Gulf-front and beachfront property carries under six months and the Gulf-access canals about eight and a half. The median sale closed at 89% of its original asking price and 93% of its final one.
What is the median price of a Naples waterfront home?
Across the 911 waterfront sales closed between October 1, 2025 and September 30, 2026, the median was $1,600,000 at $804 per square foot. Waterfront houses sold for a median $3,262,500 and condominiums for $1,420,000. By water, Gulf-front and beachfront property led at $1,970,000 and $944 per square foot.
Are Naples waterfront prices going down?
Per square foot, modestly. The median across the waterfront was $804 against $863 a year earlier, about 7% lower, while the number of sales rose 37% and dollar volume 22%, to $2.97 billion. The canals showed the largest change per foot, partly because more of the year’s canal sales were smaller homes in communities such as Port of the Islands.
Which Naples waterfront neighborhood sells for the most?
Among neighborhoods with ten or more waterfront sales over the twelve months to September 30, 2026, Port Royal led at a median $19,950,000 and $3,160 per square foot across 25 sales, followed by Aqualane Shores at $8,400,000 and $1,753. By number of sales, Park Shore led with 152, then The Moorings with 142 and Vanderbilt Beach with 114.
How many Naples waterfront buyers pay cash?
Eighty-two percent of the 911 waterfront sales over the twelve months to September 30, 2026 were cash purchases, against 77% the year before. Above $3 million, 90% were cash.
What was the largest Naples waterfront sale this year?
20 14th Avenue South in Olde Naples, a Gulf-front estate that closed at $62,500,000 in September 2026 after 688 days on the market, at 70% of its final asking price. Next were 4296 Cutlass Lane in Port Royal at $55,000,000 in January and two Port Royal homes at about $40,000,000, on Rum Row and Admiralty Parade East.
How often is this Naples waterfront market report updated?
On the first of every month, with the month just closed. This edition covers closed sales from October 1, 2025 through September 30, 2026, compared with the twelve months before, and inventory as of October 1, 2026, from the Naples Area Board of REALTORS® MLS.
Data source: Naples Area Board of REALTORS® MLS data for residential property in the City of Naples on salt water, compiled by Alpizar & Company. Inventory as of October 1, 2026; closed sales October 1, 2025 through September 30, 2026, compared with October 1, 2024 through September 30, 2025. Unsold listings are those terminated, withdrawn or expired during September 2026. Waterfront classification is our own, as set out above. Market data is deemed reliable but not guaranteed and is not a valuation of any individual property.
Meet the Team
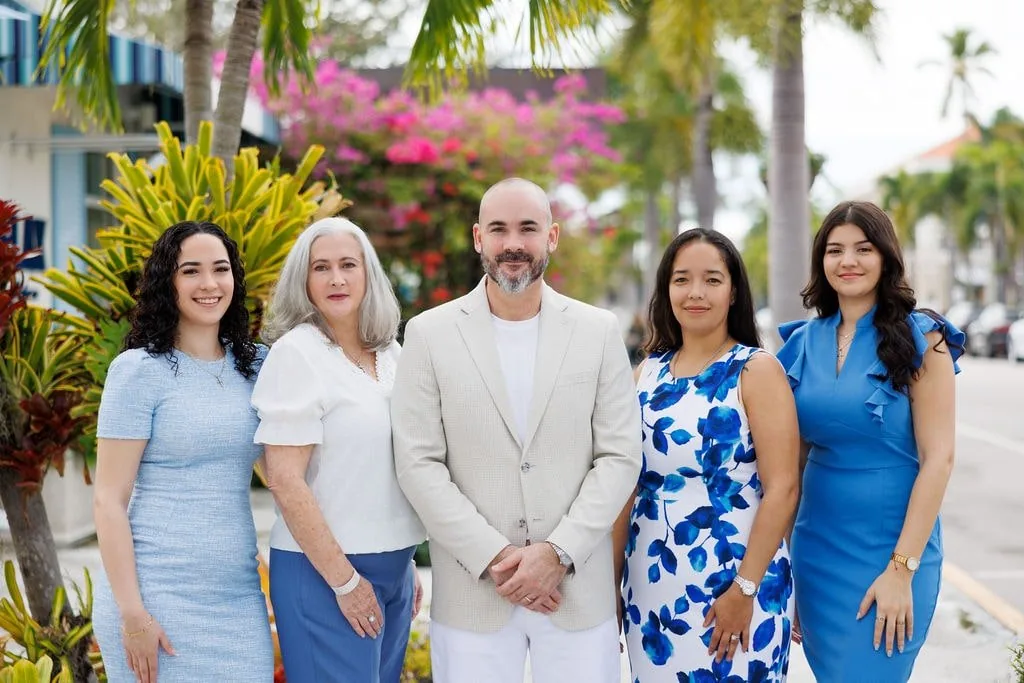
Connect with Real Estate Advisors... not Salespeople.
Alpizar & Company is a family-owned independent brokerage specializing in luxury waterfront real estate in Naples, Marco Island and Bonita Springs. Led by Robert Alpizar (CLHMS, GRI, SRS, PSA) and Marlene Alpizar, our team operates as advisors — not salespeople — guiding buyers and sellers with firsthand local expertise and no corporate quotas.
We offer complimentary, pressure-free consultations without any commitment.
How can we Help?
Over 250 closed transactions. $100 million in Naples luxury waterfront sales. Read what our buyers and sellers say about working with an advisor-driven independent brokerage — and why they come back.
What's it like working with Alpizar & Company?