
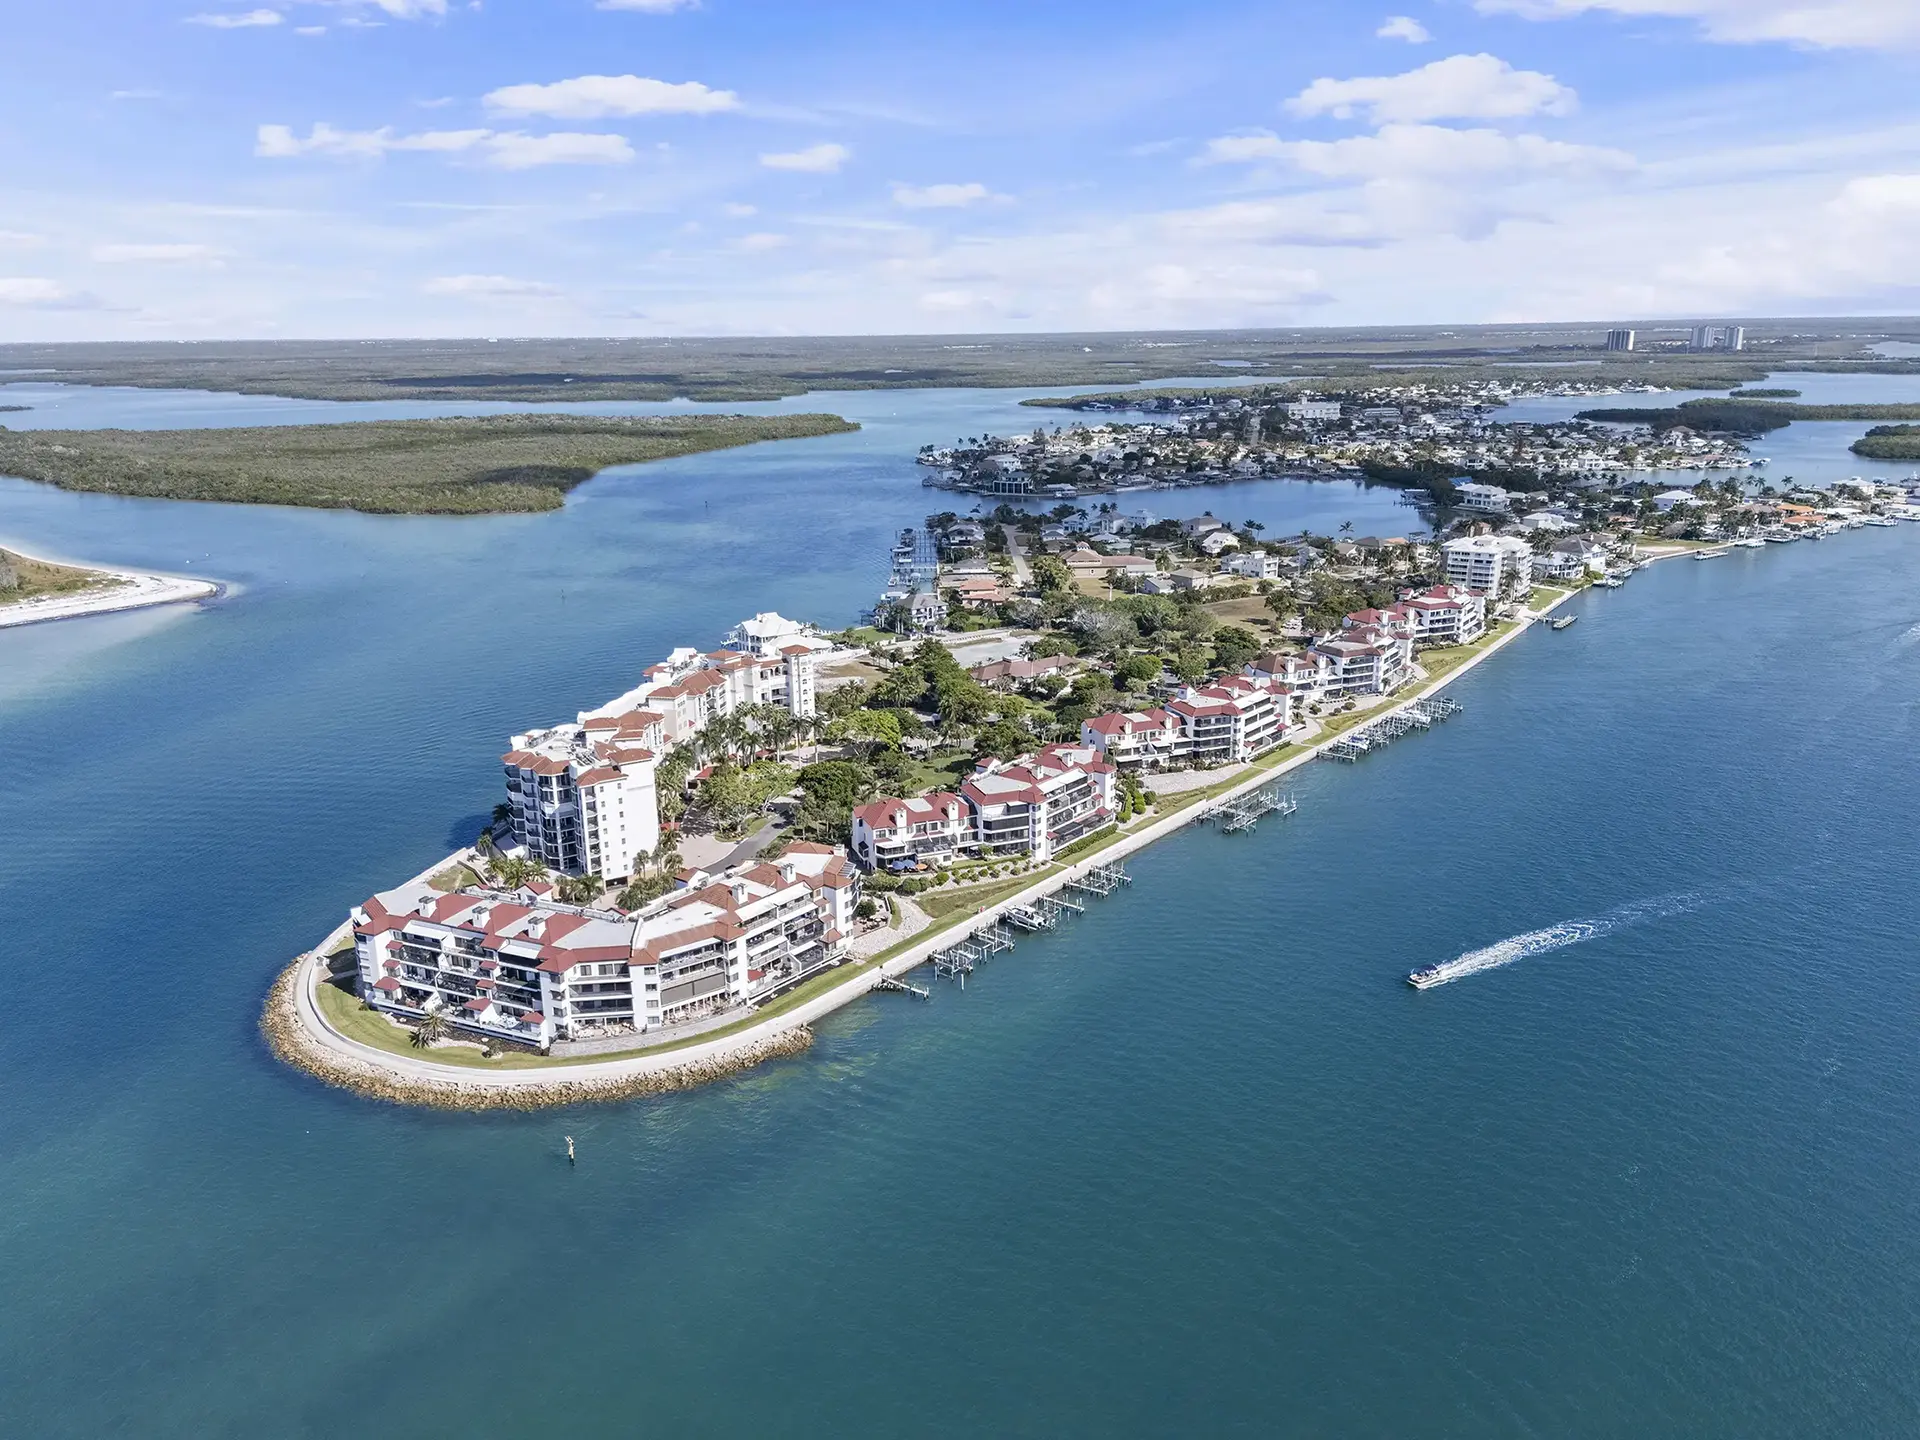
Waterfront home prices rose about 23% a foot, La Peninsula fell 15%, and September was the busiest month of the year.
We pull the Isles of Capri numbers every month and publish them here in full: inventory, months of supply, price per square foot and what actually closed, split the way island buyers shop, between the waterfront homes, the homes off the water, the La Peninsula condominiums and the island’s other buildings. For the island itself, see our guide to Isles of Capri.
September 2026 — Inventory
| Segment | Listings | Supply |
|---|---|---|
| Waterfront homes | 13 active 2 pending |
14.2 months |
| Other homes | 2 active 1 pending |
6.0 months |
| La Peninsula condos | 10 active 0 pending |
12.0 months |
| Other condos | 5 active 1 pending |
12.0 months |
| All Isles of Capri | 30 active 4 pending |
12.0 months |
Months of supply compares the homes and residences offered today with the pace of sales over the last twelve months. Isles of Capri carries about a year of supply, with thirty properties offered against thirty sales, and the waterfront homes, at fourteen months, carry the most.
Twelve-Month Performance
| Segment | Sales | Per Sq Ft |
|---|---|---|
| Waterfront homes | 11 · $1.48M Prior year: 14 · $1.35M |
$848 · 83% Prior year: $690 · 85% |
| Other homes | 4 · $729K Prior year: 4 · $610K |
$427 · 85% Prior year: $366 · 66% |
| La Peninsula condos | 10 · $585K Prior year: 11 · $875K |
$394 · 77% Prior year: $462 · 91% |
| Other condos | 5 · $480K Prior year: 3 · $275K |
$377 · 85% Prior year: $294 · 70% |
| All Isles of Capri | 30 · $820K Prior year: 32 · $999K |
$440 · 82% Prior year: $521 · 85% |
Thirty homes and condominiums closed over the twelve months to September 30, 2026 for $34.0 million, against 32 for $36.6 million the year before. The island split in two. Waterfront homes rose to a median $848 a square foot from $690, about 23% more, while La Peninsula condominiums fell to $394 from $462, about 15% less, and closed at 77% of their original asking price against 91%. The island-wide median fell to $820,000 from $999,000 because condominiums made up more of what sold. Median days on market were 96 for waterfront homes (78 the year before) and 155 at La Peninsula (96). The percentage above is the closing price against the original asking price. The year’s highest price was $5,700,000, for 26 Dolphin Circle in March 2026, recorded as a private sale.
Inventory as of October 1, 2026. Sales, medians, price per square foot, days on market and percentage of asking price reflect the 30 sales closed between October 1, 2025 and September 30, 2026, against the 32 closed in the twelve months before. Source: Naples Area Board of REALTORS® MLS.
What September Closed
Six sales, against two in September 2025, the busiest month of the Isles of Capri year:
| 167 San Salvador Street | Waterfront home — $1,800,000, 3,371 sq ft, $534 per sq ft, 17 days on market, 84% of its $2,149,000 asking price |
| 23 West Pelican Street | Waterfront home — $1,650,000, 1,516 sq ft, $1,088 per sq ft, 49 days on market, 83% of its original $1,999,000 asking price and 92% of its final $1,800,000 |
| 160 San Salvador Street | Waterfront home — $1,000,000, 1,893 sq ft, $528 per sq ft, 321 days on market, 63% of its original $1,599,000 asking price and 87% of its final $1,149,000 |
| 103 Tahiti Circle | Home — $683,000, 1,775 sq ft, $385 per sq ft, 482 days on market, 80% of its original $850,000 asking price and 98% of its final $695,000 |
| 645 La Peninsula Boulevard | La Peninsula — $645,000, 1,440 sq ft, $448 per sq ft, 367 days on market, 76% of its original $849,000 asking price and 92% of its final $699,000 |
| 330 Kon Tiki Drive #B1 | Tarpon Village — $365,000, 935 sq ft, $390 per sq ft, 12 days on market, 99% of its $369,000 asking price |
Not one Isles of Capri listing left the market unsold in September; none was terminated, withdrawn or expired, against seven in July and three in August. Three new contracts were signed: waterfront homes on Pelican Street East and Jamaica Drive, offered at $1,690,000 and $1,395,000, and a Marco Towers residence offered at $399,000. A home on West Hilo Street, offered at $1,599,000, has been under contract since May.
The Gap Between Asking and Achieved
Median asking price per square foot for the homes and residences offered on October 1, 2026, against the median buyers paid over the last twelve months:
| Segment | Asking | Paid |
|---|---|---|
| Waterfront homes | $927 9% above paid |
$848 last 12 months |
| Other homes | $458 7% above paid |
$427 last 12 months |
| La Peninsula condos | $452 15% above paid |
$394 last 12 months |
| Other condos | $475 26% above paid |
$377 last 12 months |
Waterfront homes are priced close to the market, about 9% above what buyers have paid, and three of September’s six sales were waterfront homes. La Peninsula listings ask about 15% more than buyers paid in a year when prices there fell, which is why residences there have been selling at 77% of their first price after five months. Every figure here rests on a handful of sales, so read them as direction rather than precision.
When Isles of Capri Actually Trades
Closings by month over the last year: 2 in October, 1 in November, 2 in December, 1 in January, none in February, 4 in March, 5 in April, 3 in May, 4 in June, none in July, 2 in August and 6 in September. Only half the year’s closings fell between November and May; Isles of Capri trades through the year, with September the busiest month of all, so a well-priced listing can find its buyer in any month.
What We Mean by Waterfront Homes, La Peninsula and Other Condos
These groupings are ours, drawn from the MLS records. Waterfront homes: the single-family homes on the island’s canals and bay frontage, nearly all with docks. Other homes: the homes off the water. La Peninsula condos: the residences along La Peninsula Boulevard, including Twin Dolphins, on our La Peninsula page. Other condos: the island’s other buildings, such as Tarpon Village and Marco Towers. One private sale recorded in the MLS after closing is included in the prices and excluded from days on market.
What This Means If You Are Selling
Know which island you are selling on. Waterfront homes are rising and priced close to the market, so a home presented well and priced at the recent closings sells; at La Peninsula prices have softened, and the residences that started high sold at three-quarters of their first price. With a year of supply, the price at launch decides the outcome. We have sold and managed homes on Isles of Capri, and we prepare a confidential valuation from the sales that genuinely compare to your home or residence, and we will tell you if the number you have in mind is not in the data.
Isles of Capri - Recent Sales
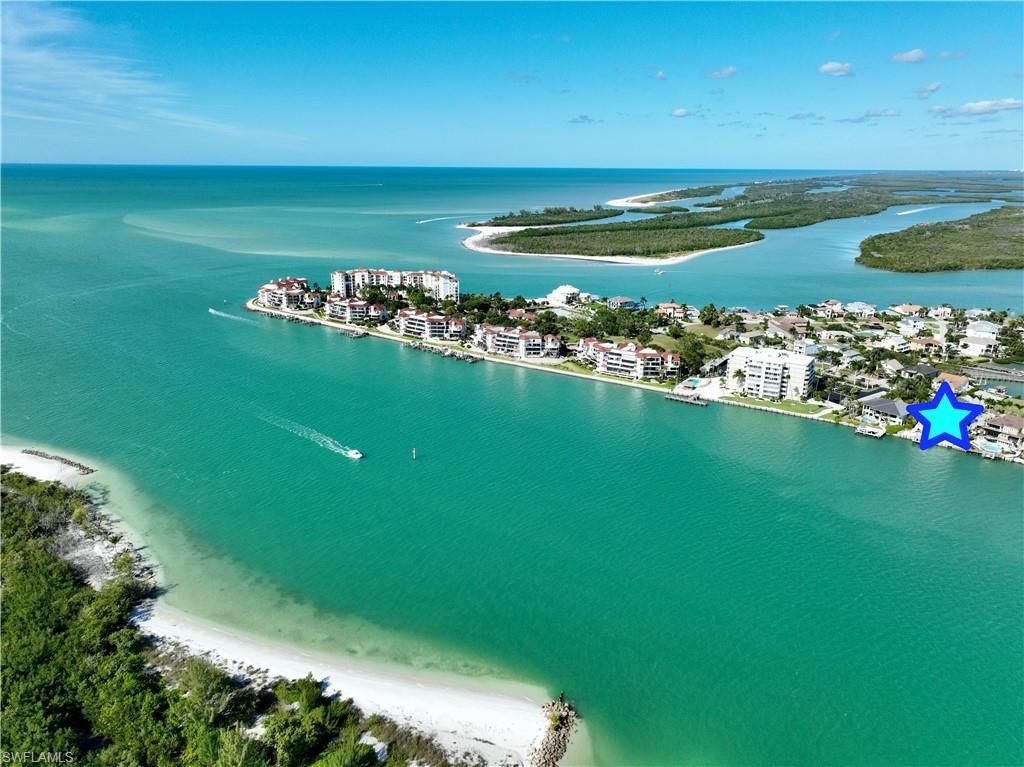

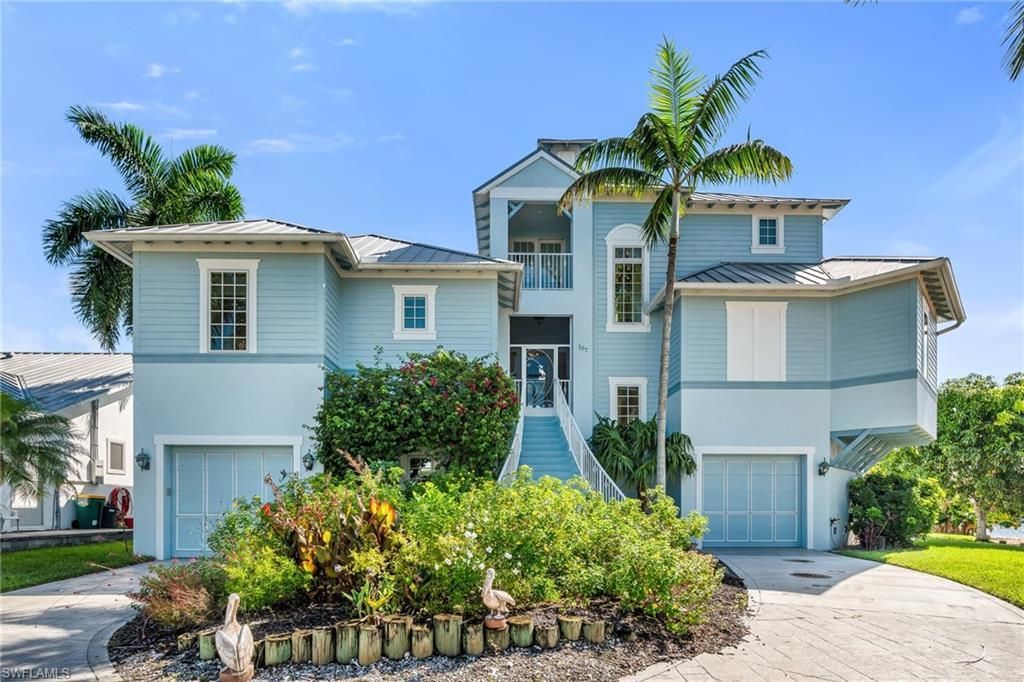
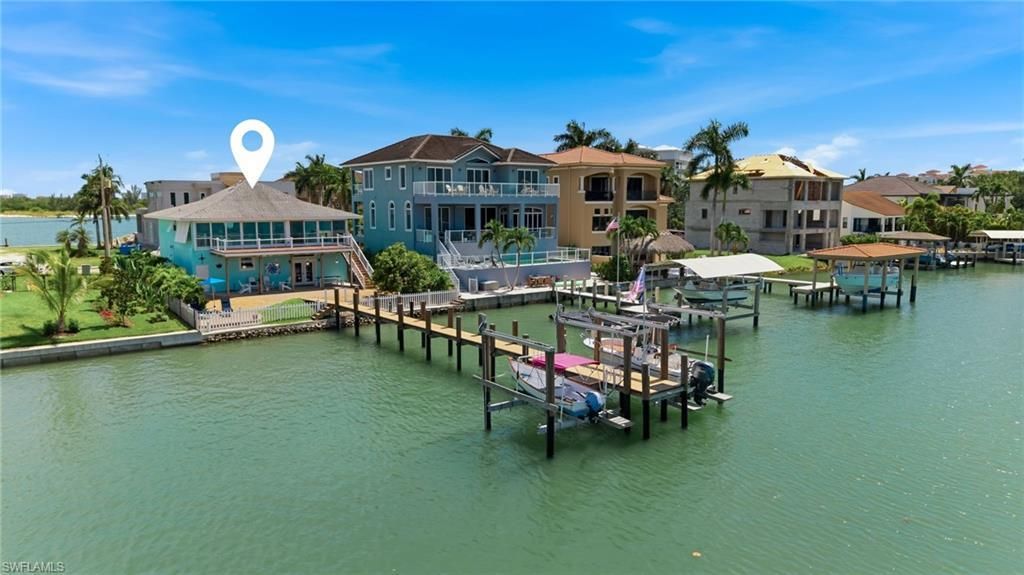
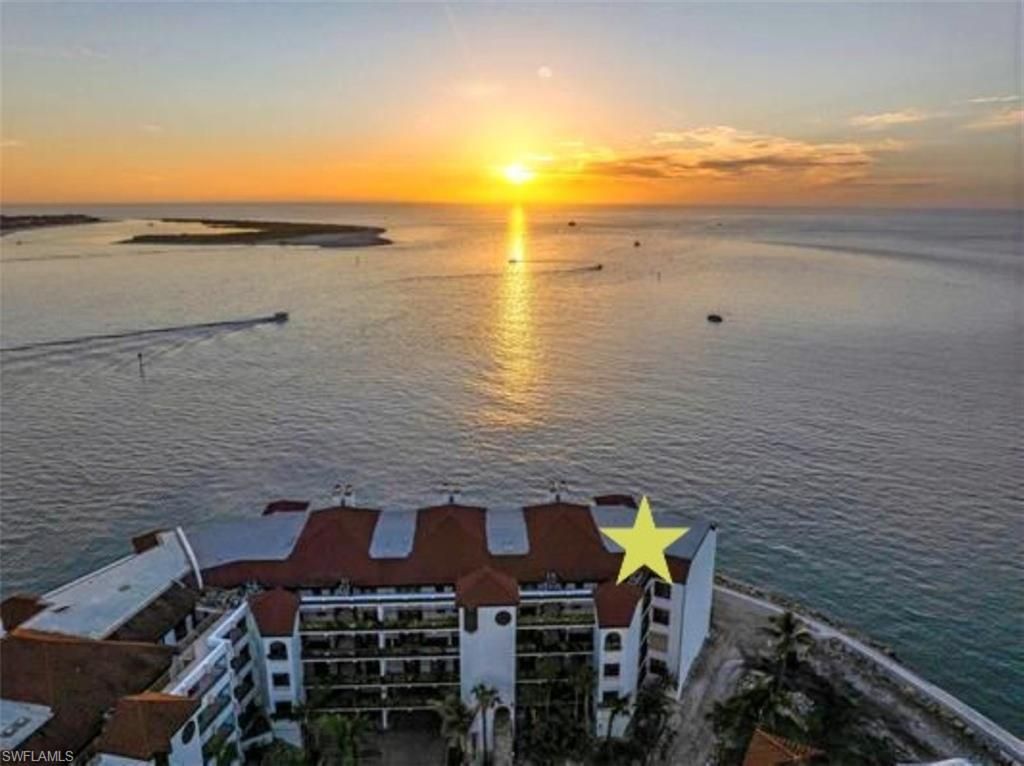
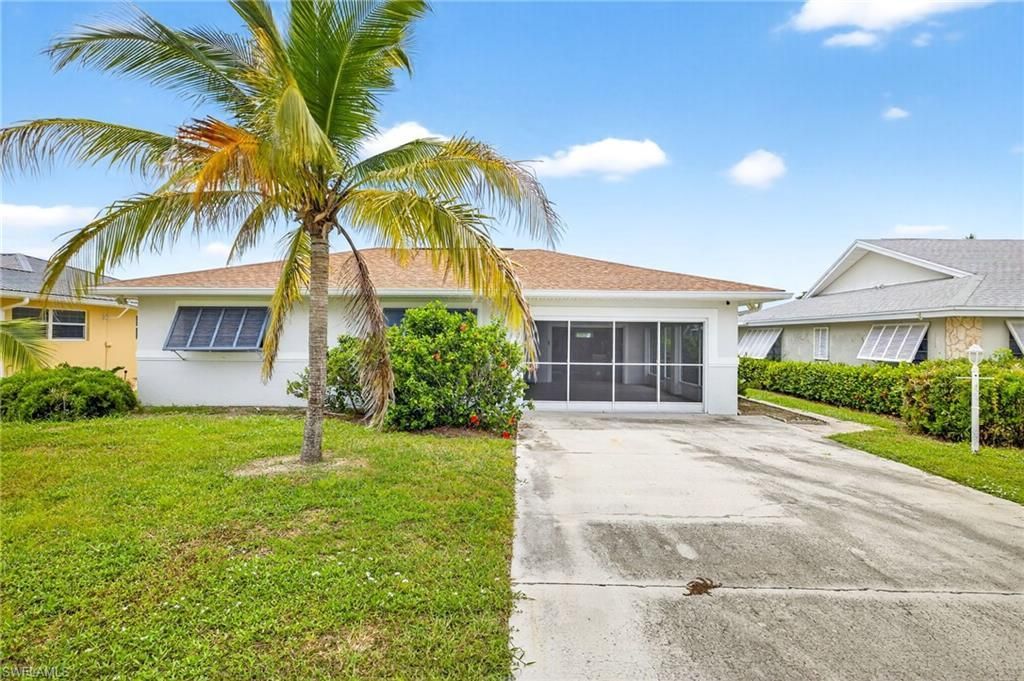
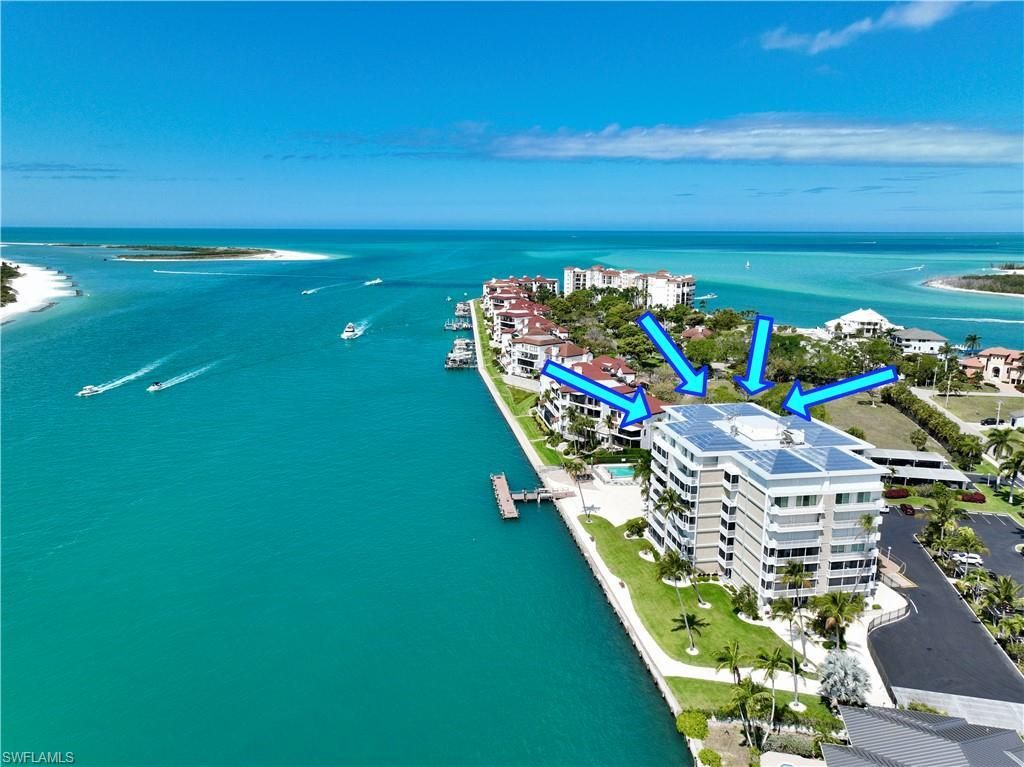
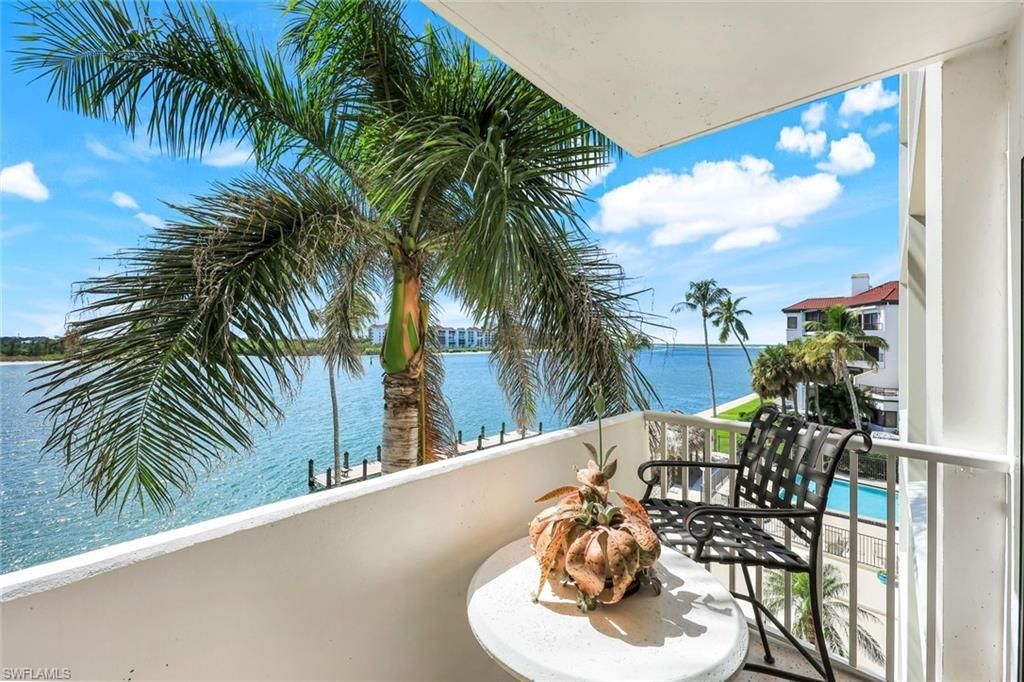
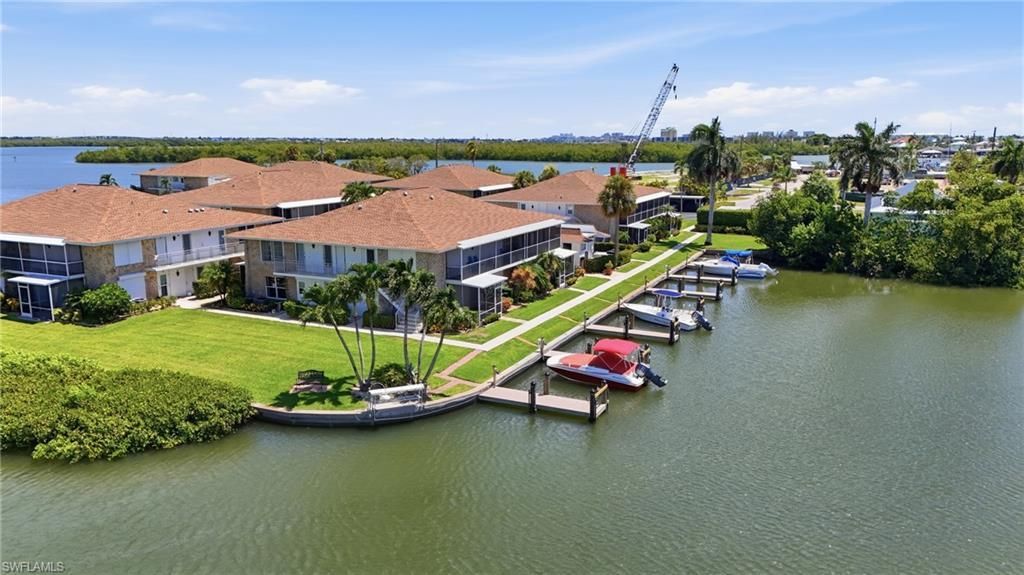
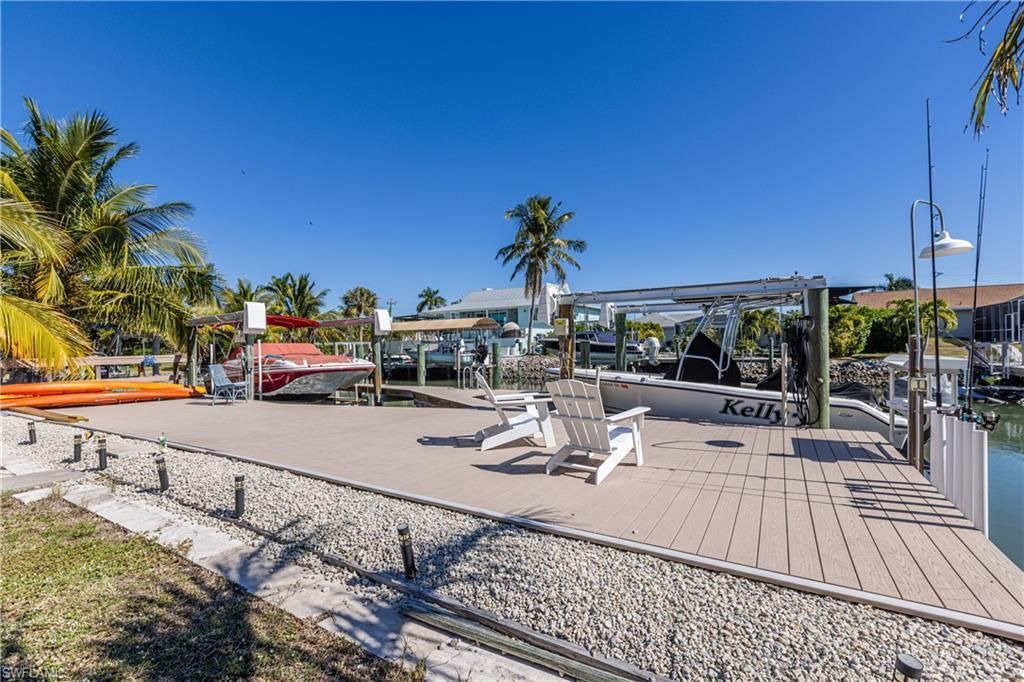
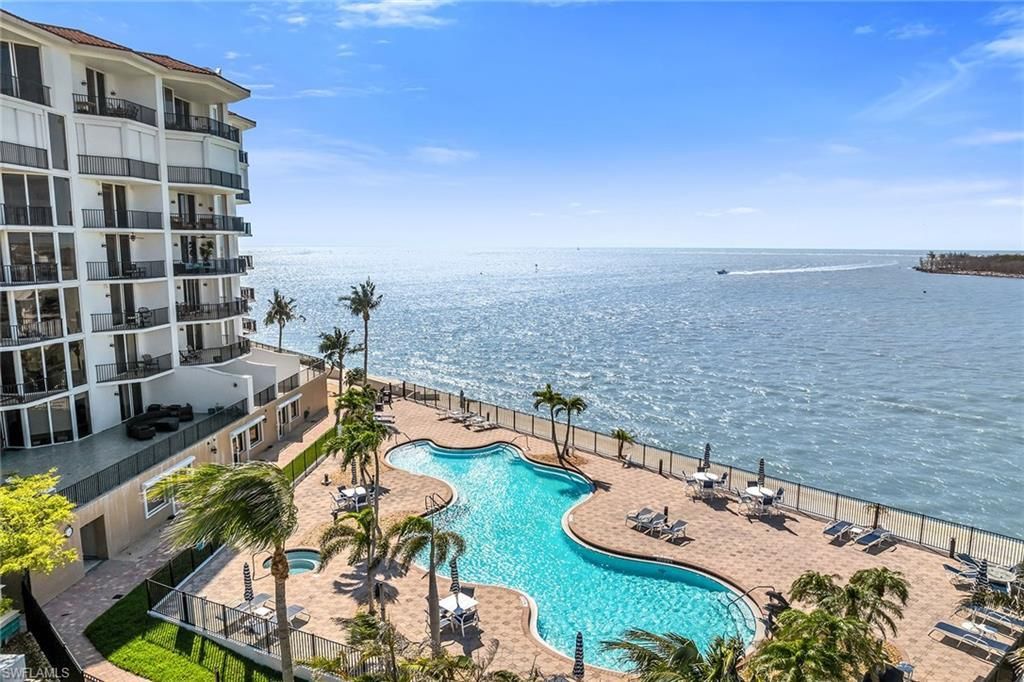
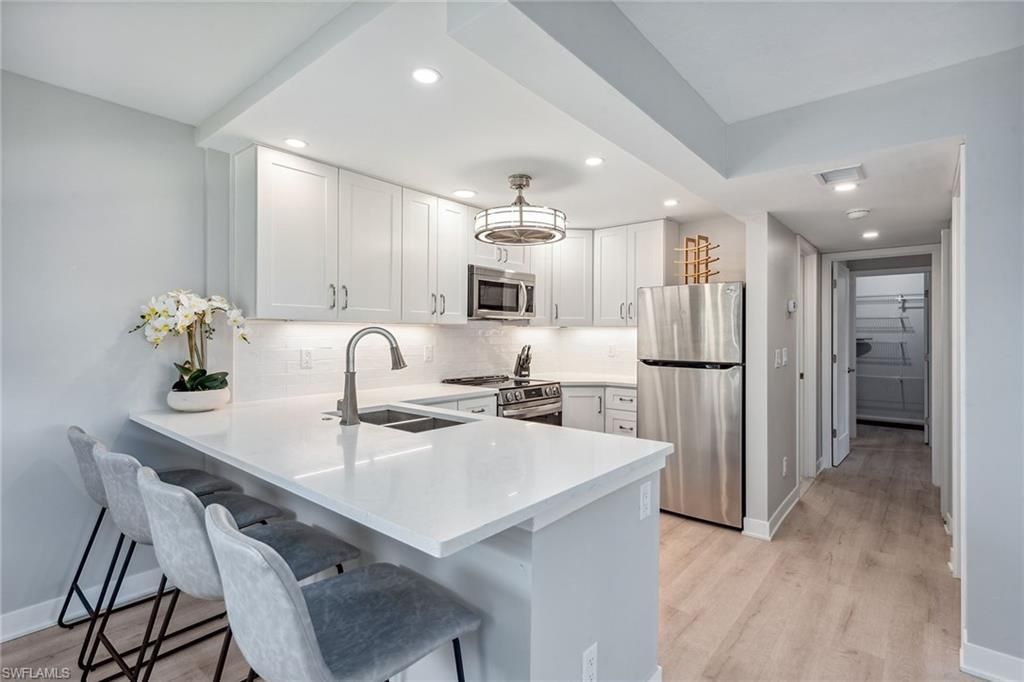
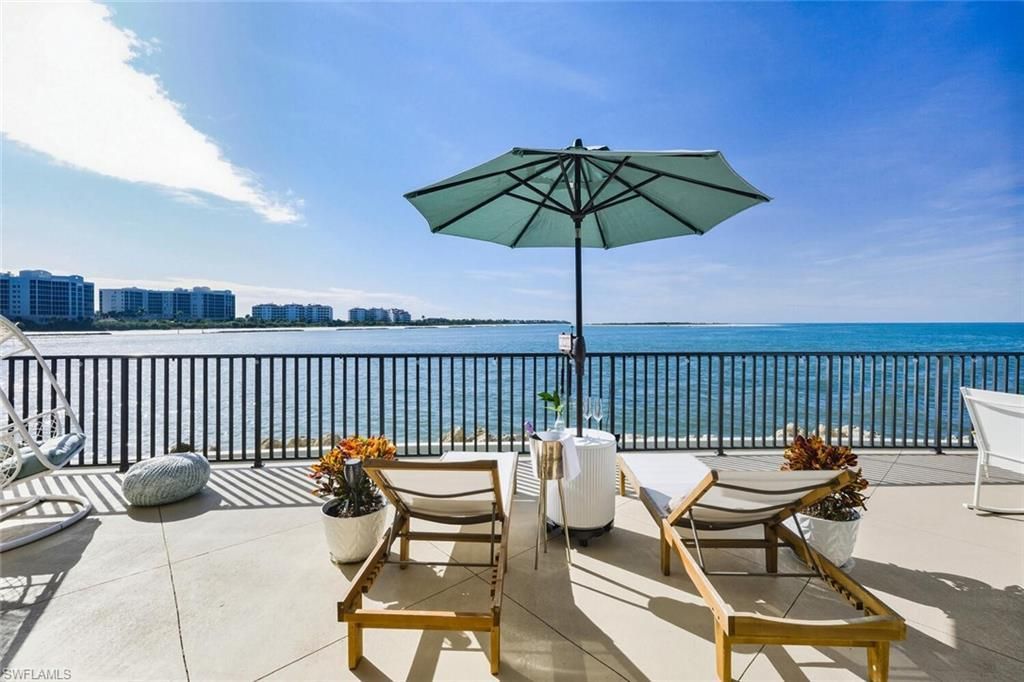
Explore Isles of Capri
Nearby Waterfront
Isles of Capri Market Questions
Is Isles of Capri a buyer’s or a seller’s market?
Balanced to favoring buyers. Isles of Capri carries about twelve months of supply, with 30 properties for sale against 30 sales over the last twelve months, and the median sale closed at 82% of its original asking price. Waterfront homes, rising in price, carry about fourteen months.
What is the median price on Isles of Capri?
Across the 30 sales closed between October 1, 2025 and September 30, 2026, the median was $820,000 at $440 per square foot. Waterfront homes sold for a median $1,480,000, La Peninsula condominiums for $585,000 and the island’s other condominiums for $480,000. The highest price was $5,700,000, for 26 Dolphin Circle in March 2026.
Are Isles of Capri prices rising?
For waterfront homes, yes: they sold for a median $848 per square foot against $690 the year before, about 23% more. La Peninsula condominiums went the other way, to $394 per square foot from $462, about 15% less. The island-wide median fell because more condominiums sold.
How much below asking do Isles of Capri properties sell for?
The median sale over the twelve months to September 30, 2026 closed at 82% of its original asking price and 93% of its final one, against 85% of the original price the year before. La Peninsula condominiums were softest, at 77% of their original price.
How often is this report updated?
On the first of every month, with the month just closed. This edition covers closed sales through September 30, 2026 and inventory as of October 1, 2026, from the Naples Area Board of REALTORS® MLS.
Can I get figures for a specific street or building?
Yes. We hold the full sales history for Isles of Capri and can prepare a report for any street, building or home, including months earlier than this edition. Call (239) 438-1102 and tell us what you need.
Data source: Naples Area Board of REALTORS® MLS data for Isles of Capri. Inventory as of October 1, 2026; closed-sale figures cover October 1, 2025 through September 30, 2026, compared with October 1, 2024 through September 30, 2025. Unsold listings are those terminated, withdrawn or expired during September 2026. Segment definitions are our own and are set out above. Market data is deemed reliable but not guaranteed and is not a valuation of any individual property.
Meet the Team
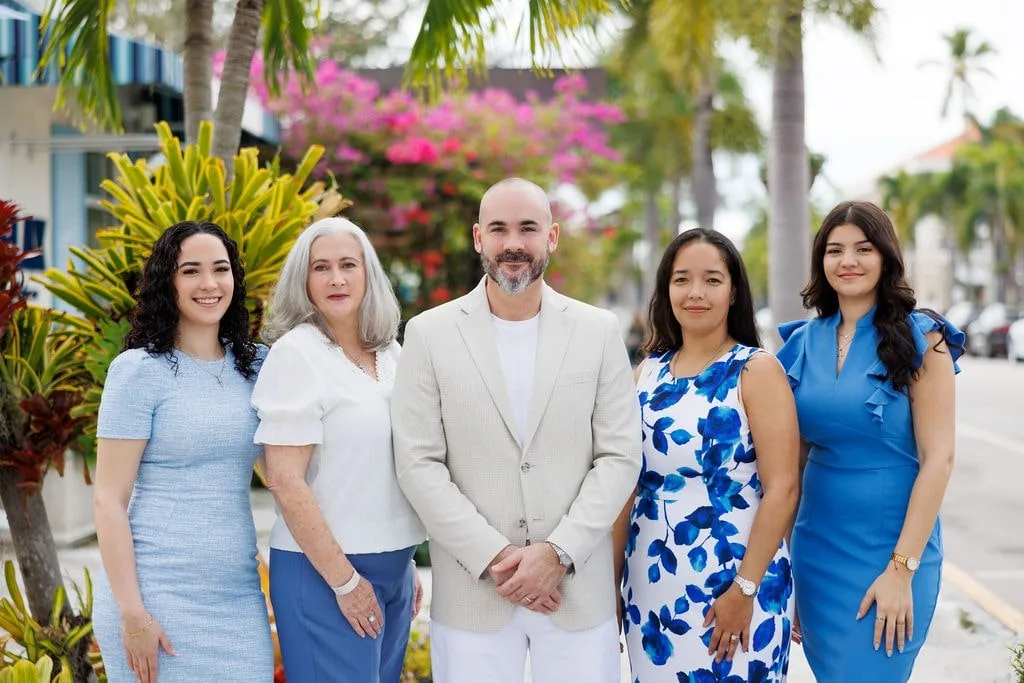
Connect with Real Estate Advisors... not Salespeople.
Alpizar & Company is a family-owned independent brokerage specializing in luxury waterfront real estate across Naples' most sought-after neighborhoods. Led by Robert Alpizar (CLHMS, GRI, SRS, PSA) and Marlene Alpizar, our team operates as advisors — not salespeople — guiding buyers and sellers with firsthand local expertise and no corporate quotas.
We offer complimentary, pressure-free consultations without any commitment.
How can we Help?
Over 250 closed transactions. $100 million in Naples luxury waterfront sales. Read what our buyers and sellers say about working with an advisor-driven independent brokerage — and why they come back.
What's it like working with Alpizar & Company?