
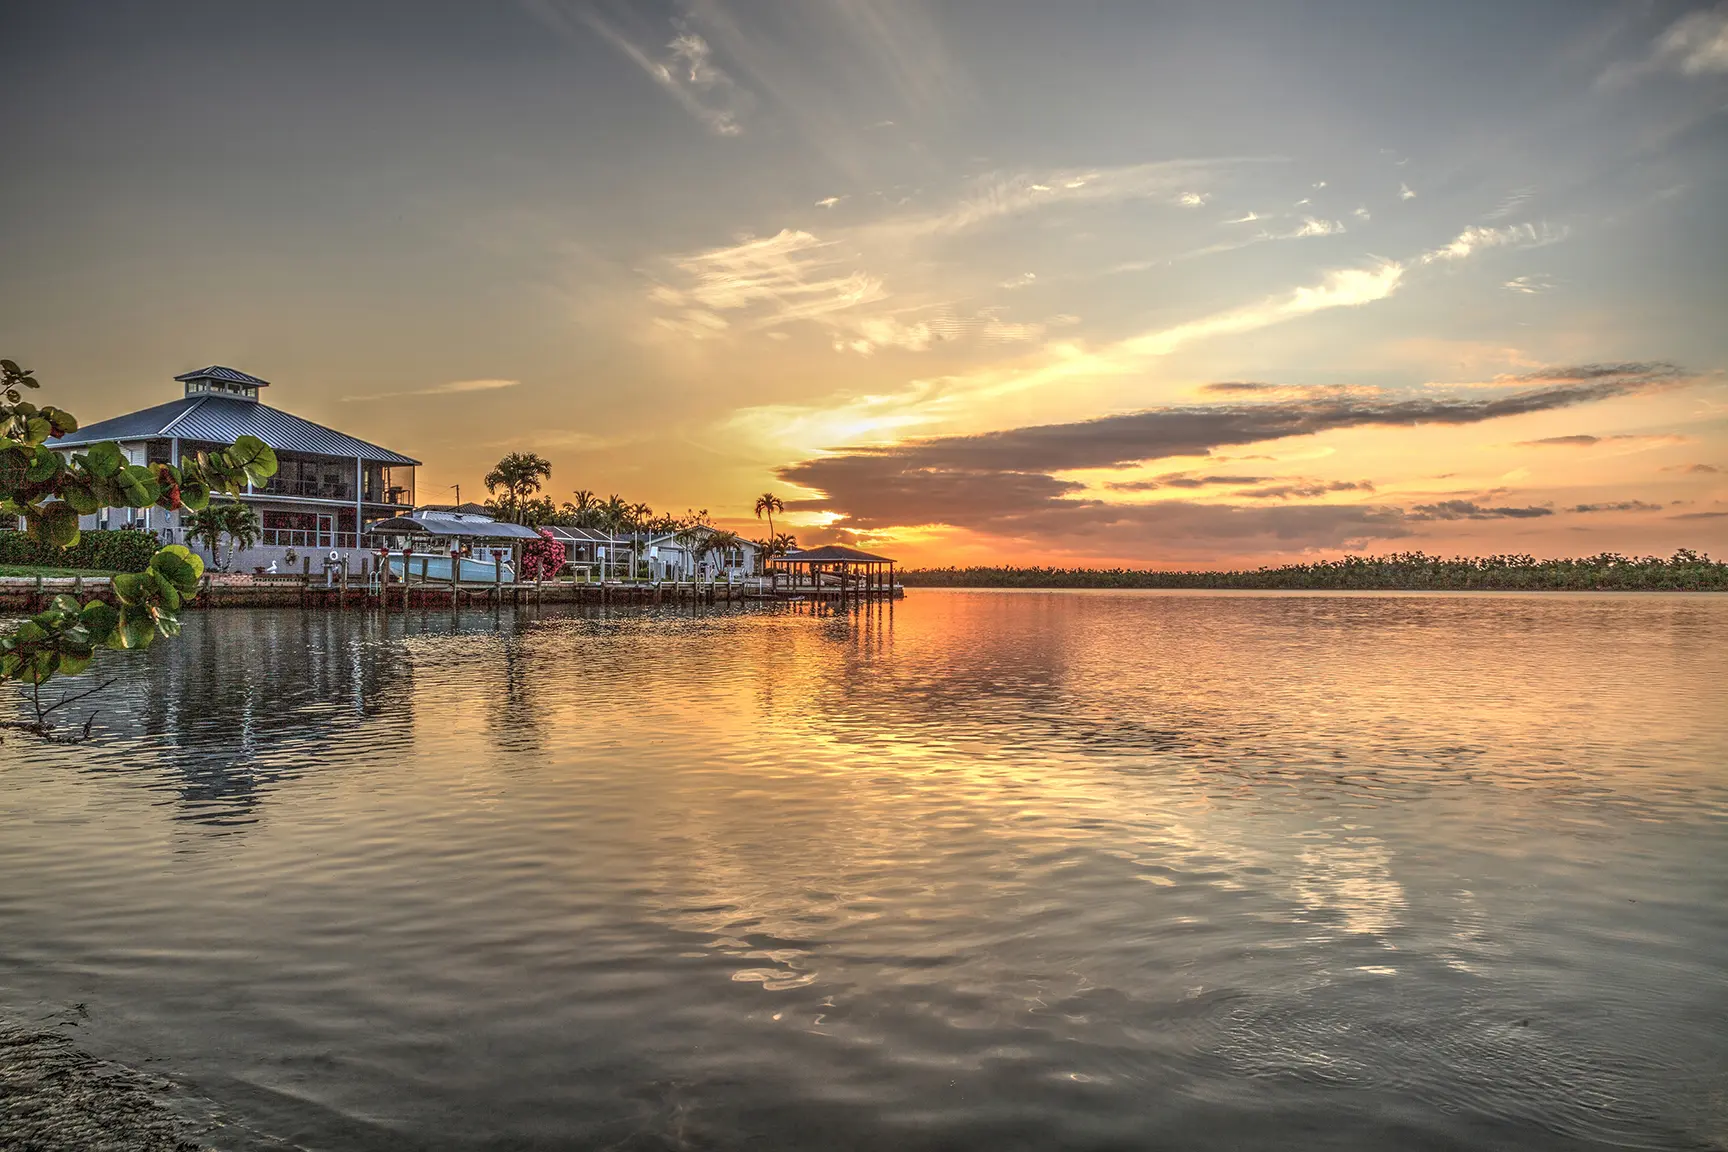
Thirty-one homes for sale against 27 sales in a year: Aqualane Shores has more than a year of supply.
We pull the Aqualane Shores numbers every month and publish them here in full: inventory, months of supply, price per square foot and what actually closed, split the way Aqualane buyers shop, between the homes on Naples Bay, the homes on the canals and the homes off the water near Gordon Drive and the beach. For the neighborhood itself, see our guide to Aqualane Shores.
September 2026 — Inventory
| Segment | Listings | Supply |
|---|---|---|
| Bay-front | 2 active 0 pending |
6.0 months |
| Canal-front | 20 active 0 pending |
12.6 months |
| Off the water | 9 active 1 pending |
27.0 months |
| All Aqualane Shores | 31 active 1 pending |
13.8 months |
Months of supply compares the homes offered today with the pace of sales over the last twelve months. At almost fourteen months, Aqualane Shores carries about twice the supply of neighboring Port Royal, at 7.2, and two-thirds of what is for sale is on the canals.
Twelve-Month Performance
| Segment | Sales | Per Sq Ft |
|---|---|---|
| Bay-front | 4 · $7.9M Prior year: 5 · $13.2M |
$1,587 · 72% Prior year: $2,624 · 89% |
| Canal-front | 19 · $9.75M Prior year: 15 · $6.25M |
$1,791 · 84% Prior year: $1,393 · 79% |
| Off the water | 4 · $13.85M Prior year: 10 · $6.35M |
$2,299 · 83% Prior year: $1,808 · 83% |
| All Aqualane Shores | 27 · $9.75M Prior year: 30 · $7.45M |
$1,791 · 83% Prior year: $1,878 · 83% |
Twenty-seven homes closed over the twelve months to September 30, 2026 for $279.4 million, against 30 for $289.8 million the year before. The canals carried the year, with 19 of the 27 sales at a median $1,791 a square foot against $1,393, a rise that reflects which homes sold as much as any change in value. The bay-front and off-water figures rest on four sales each, so read them as a handful of homes rather than a trend. Median days on market rose to 174 from 106. The percentage above is the closing price against the original asking price. The year’s highest price was $20,925,000, for 1731 Gordon Drive in April 2026.
Inventory as of October 1, 2026. Sales, medians, price per square foot, days on market and percentage of asking price reflect the 27 sales closed between October 1, 2025 and September 30, 2026, against the 30 closed in the twelve months before. Source: Naples Area Board of REALTORS® MLS.
What September Closed
Three sales, against one in September 2025:
| 1707 3rd Street South | Canal-front — $19,500,000, 7,412 sq ft, $2,631 per sq ft, 93 days on market, 89% of its $21,995,000 asking price |
| 2233 Forrest Lane | Bay-front — $6,950,000, 4,890 sq ft, $1,421 per sq ft, 297 days on market, 51% of its original $13,500,000 asking price and 84% of its final $8,300,000 |
| 611 18th Avenue South | Canal-front — $6,550,000, 4,311 sq ft, $1,519 per sq ft, 414 days on market, 66% of its original $9,900,000 asking price and slightly above its final $6,500,000 |
The two homes that sold far below their first price had spent 297 and 414 days on the market. Against September’s three closings, three canal-front listings left the market unsold, two terminated at $18,495,000 and $12,400,000 and one withdrawn at $11,995,000, while one home on Gordon Drive went under contract.
The Gap Between Asking and Achieved
Median asking price per square foot for the homes offered on October 1, 2026, against the median buyers paid over the last twelve months:
| Segment | Asking | Paid |
|---|---|---|
| Bay-front | $2,484 57% above paid |
$1,587 last 12 months |
| Canal-front | $2,173 21% above paid |
$1,791 last 12 months |
| Off the water | $2,020 12% below paid |
$2,299 last 12 months |
| All Aqualane Shores | $2,145 20% above paid |
$1,791 last 12 months |
Canal-front sellers are asking about a fifth more per foot than buyers have paid, with twenty homes offered against nineteen sales in a year, and September showed what happens to a home priced above the market: it sits, and it sells well below its first price. The bay-front gap rests on two listings and four sales. Off the water the ask is below what buyers paid, because the year’s off-water sales included two of the largest homes on Gordon Drive and Gulf Shore Boulevard South.
When Aqualane Shores Actually Trades
Closings by month over the last year: 1 in October, 3 in November, 1 in December, 1 in January, 2 in February, 5 in March, 4 in April, 1 in May, 1 in June, 3 in July, 2 in August and 3 in September. Seventeen of the 27 closings fell between November and May, with March and April the busiest, and because a closing follows its contract by thirty to sixty days, those reflect contracts signed from October through March. With more than a year of supply, a home launched in season still competes with every other canal-front listing, so the price at launch matters more than the date.
What We Mean by Bay-Front, Canal-Front and Off the Water
These groupings are ours, drawn from the MLS waterfront descriptions. Bay-front: the homes with frontage on Naples Bay. Canal-front: the homes on the Aqualane canals, with boat access to Naples Bay and the Gulf. Off the water: the homes without frontage, many of them on Gordon Drive and Gulf Shore Boulevard South, a short walk from the beach. Newly built homes are on our Aqualane Shores new construction page, and land sold for redevelopment on our lots and teardowns page. One private sale recorded in the MLS after closing is included in the prices and excluded from days on market.
What This Means If You Are Selling
Price against what closed, not against the listings around you: with almost fourteen months of supply, buyers in Aqualane Shores can wait, and the two September sales that started high closed at 51% and 66% of their first price after nine months or more. A home priced at the recent closings from the first day is the one that sells in season. We prepare a confidential valuation from the sales that genuinely compare to your home, and we will tell you if the number you have in mind is not in the data.
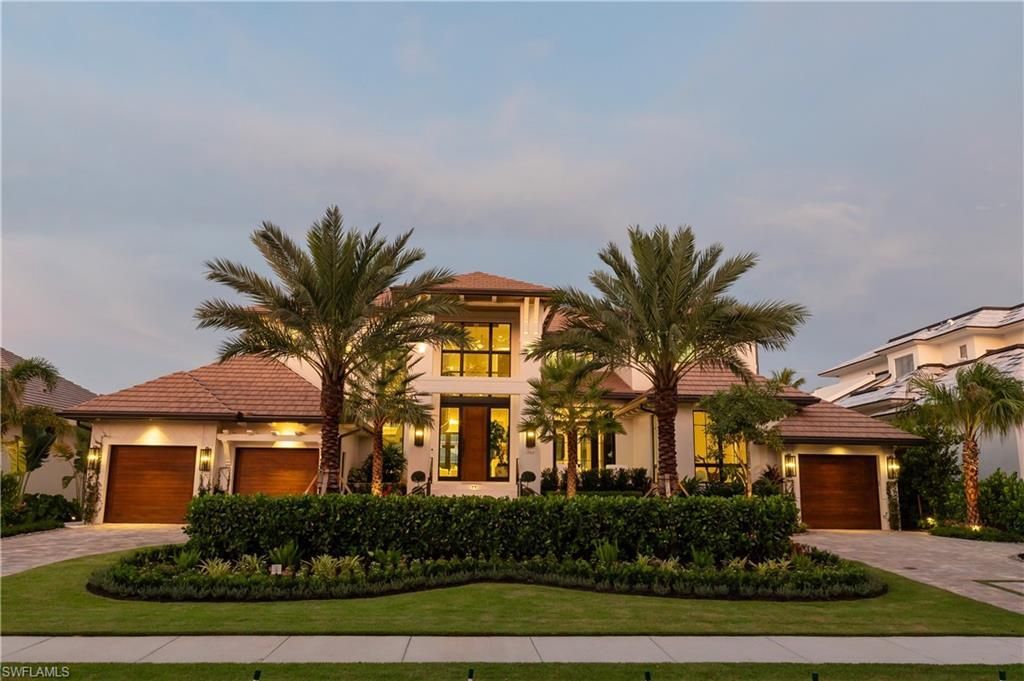
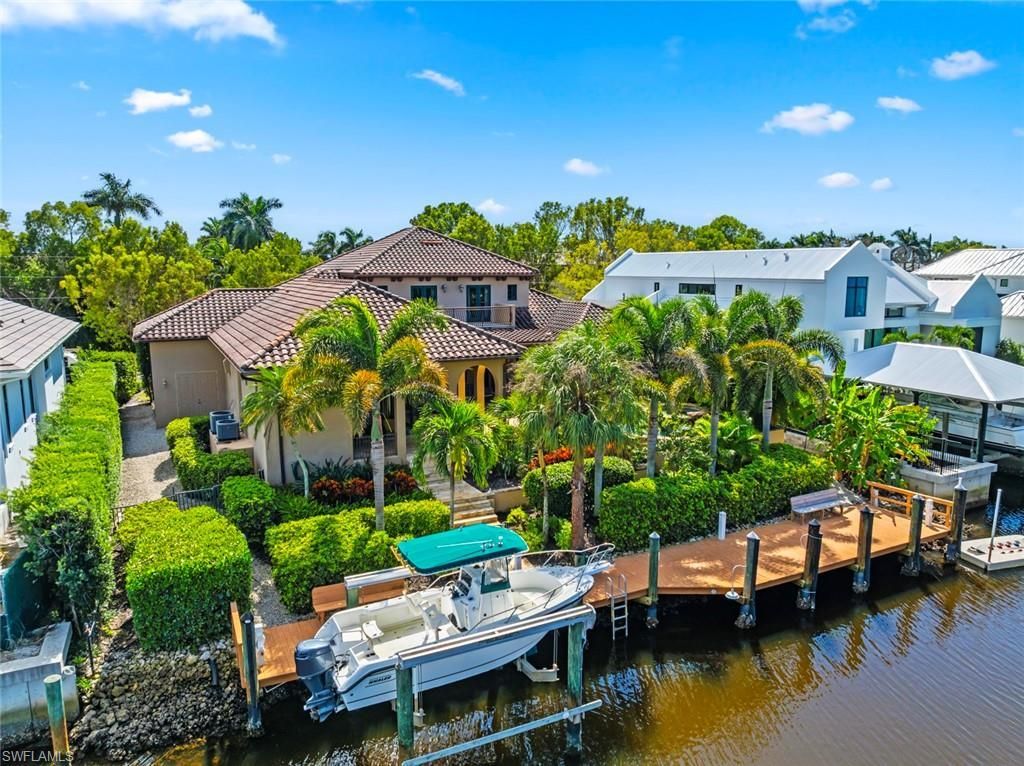
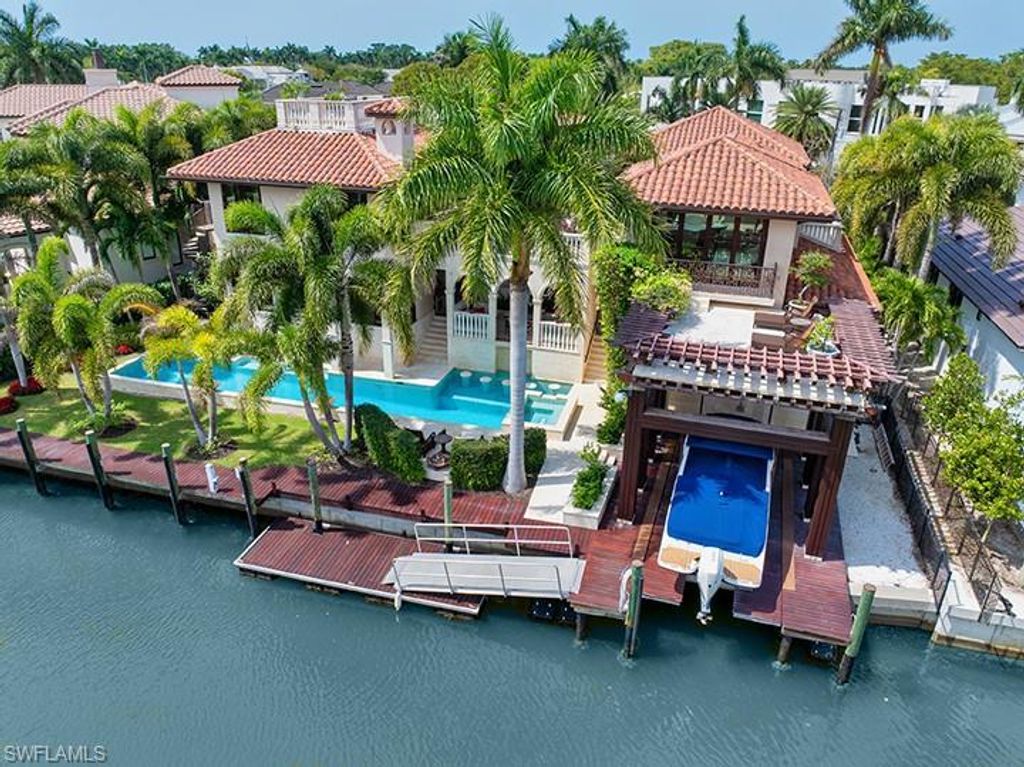
Aqualane Shores - Recent Sales

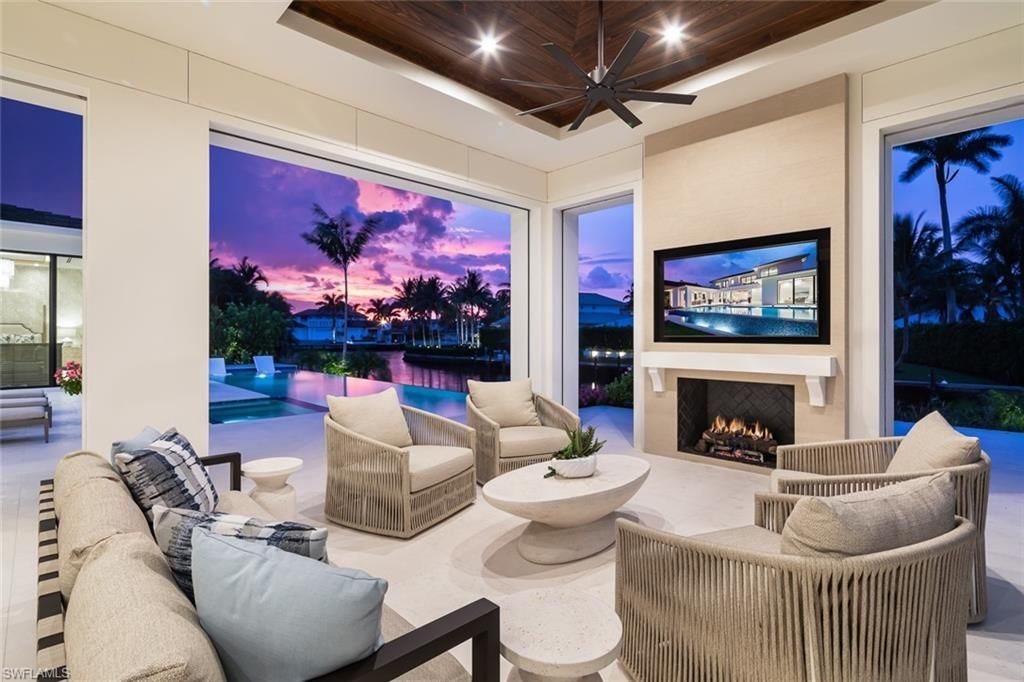
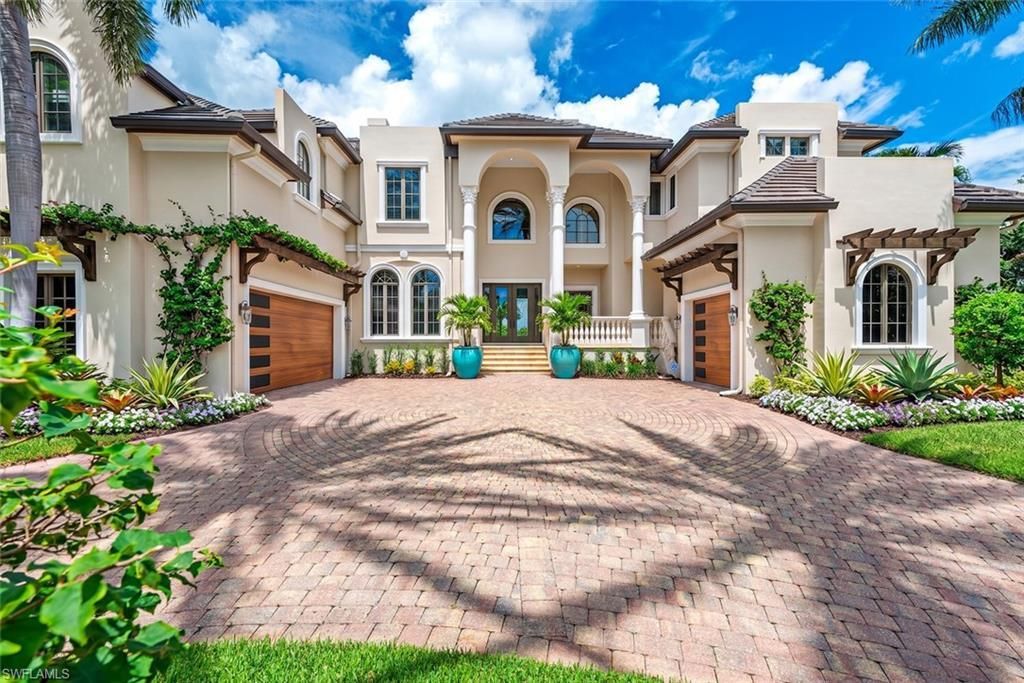
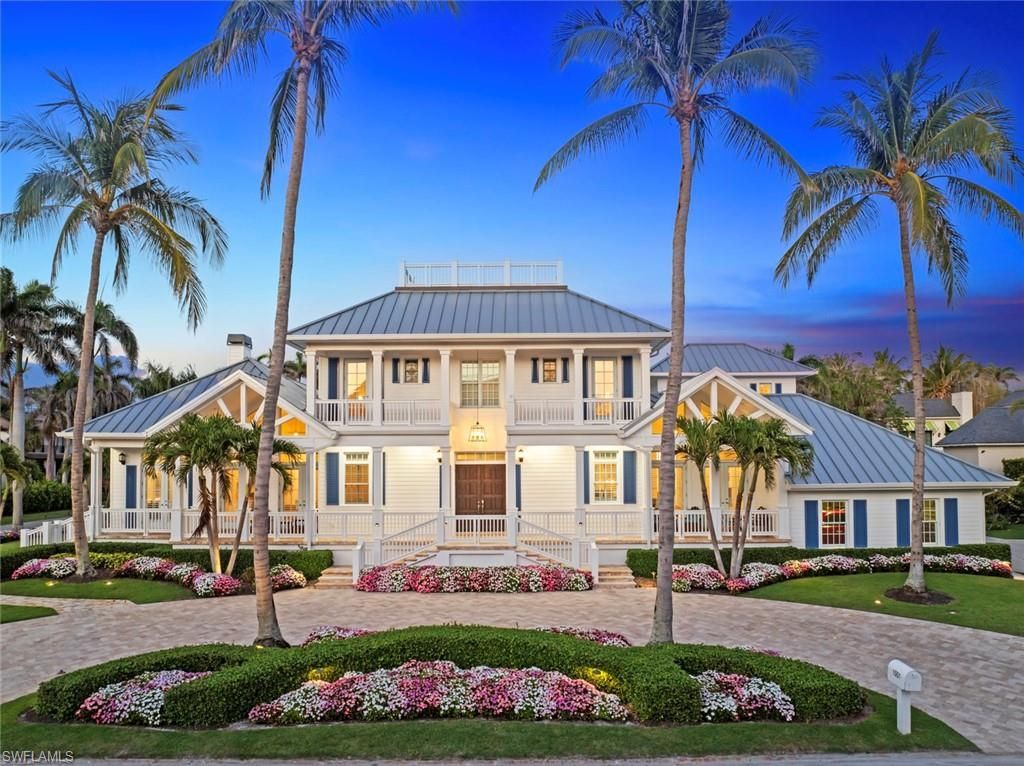
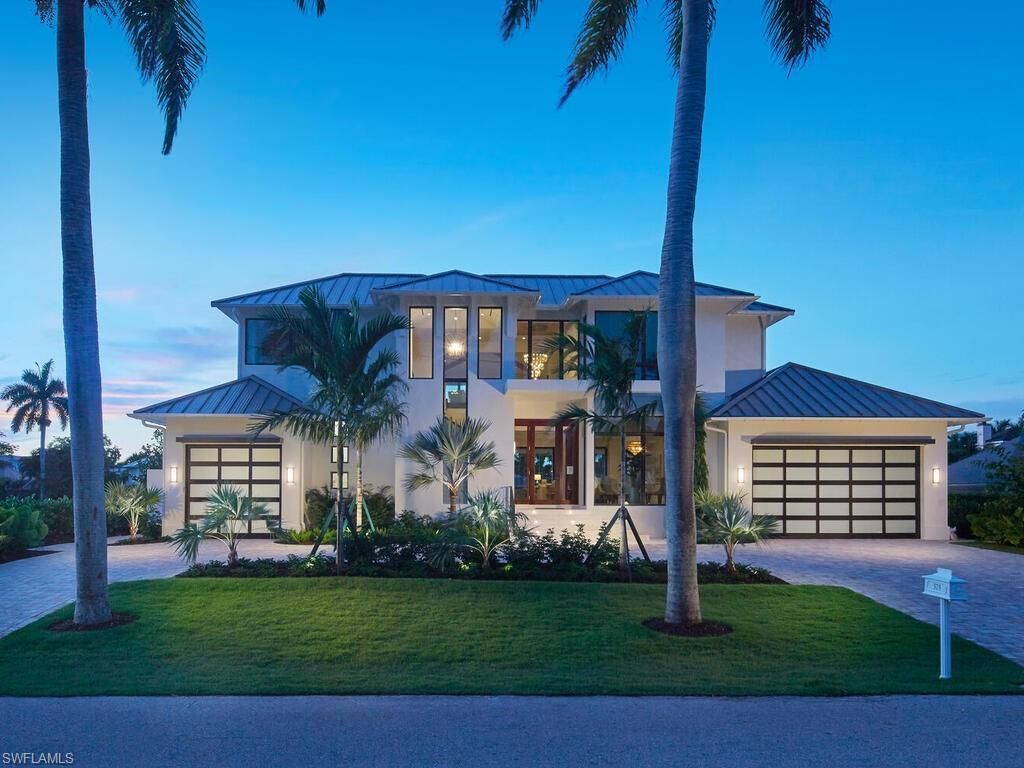
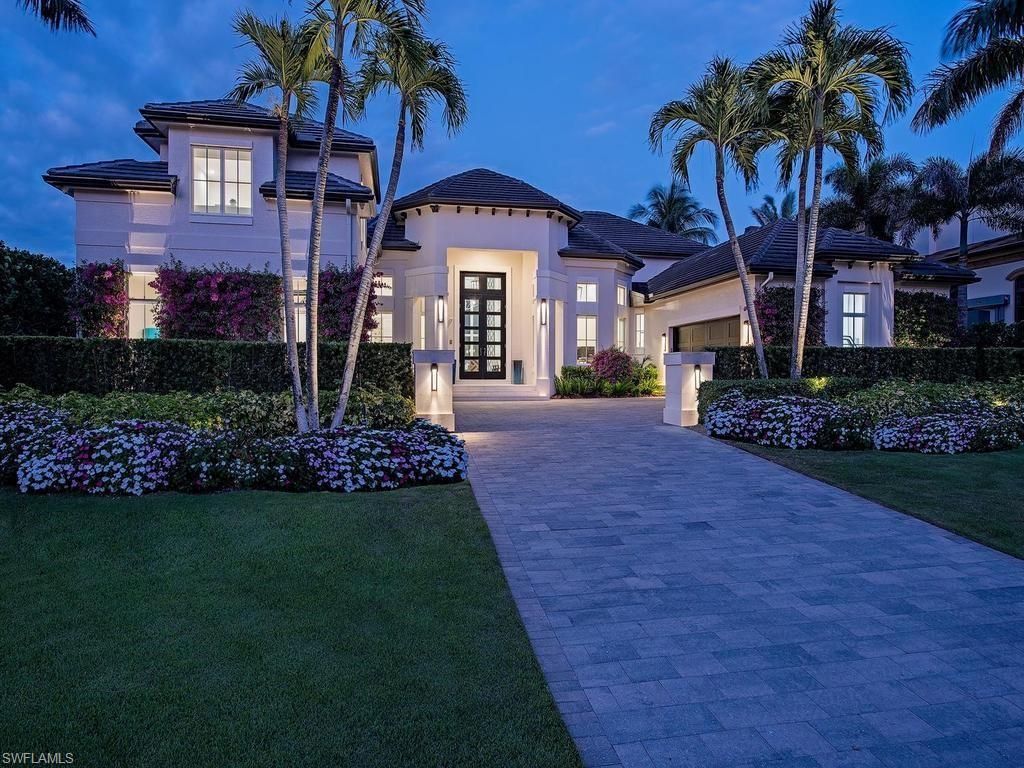
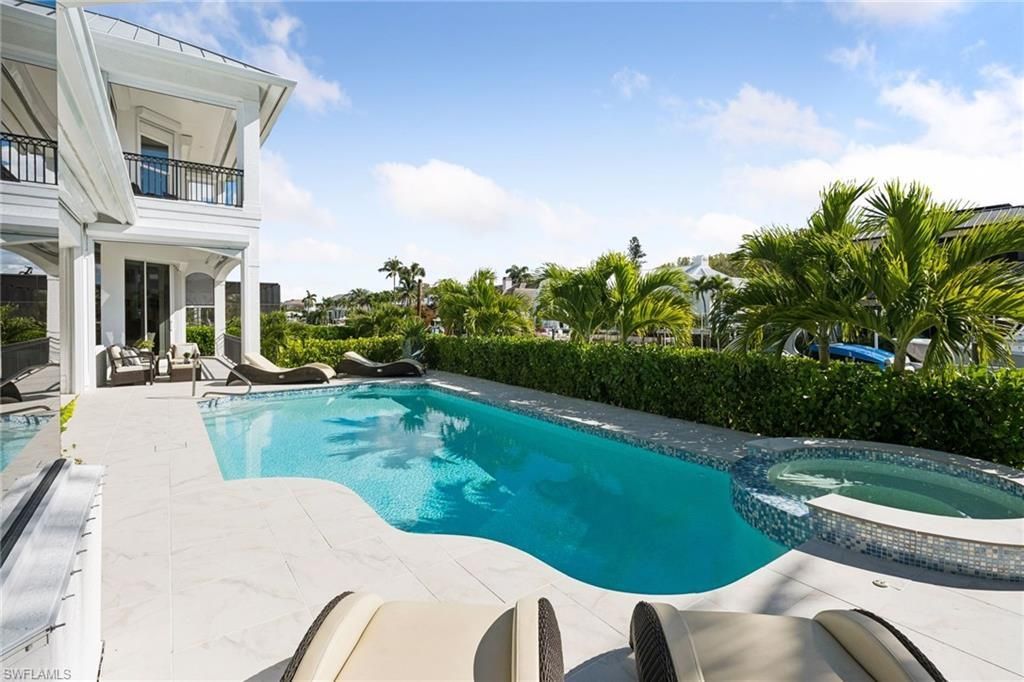
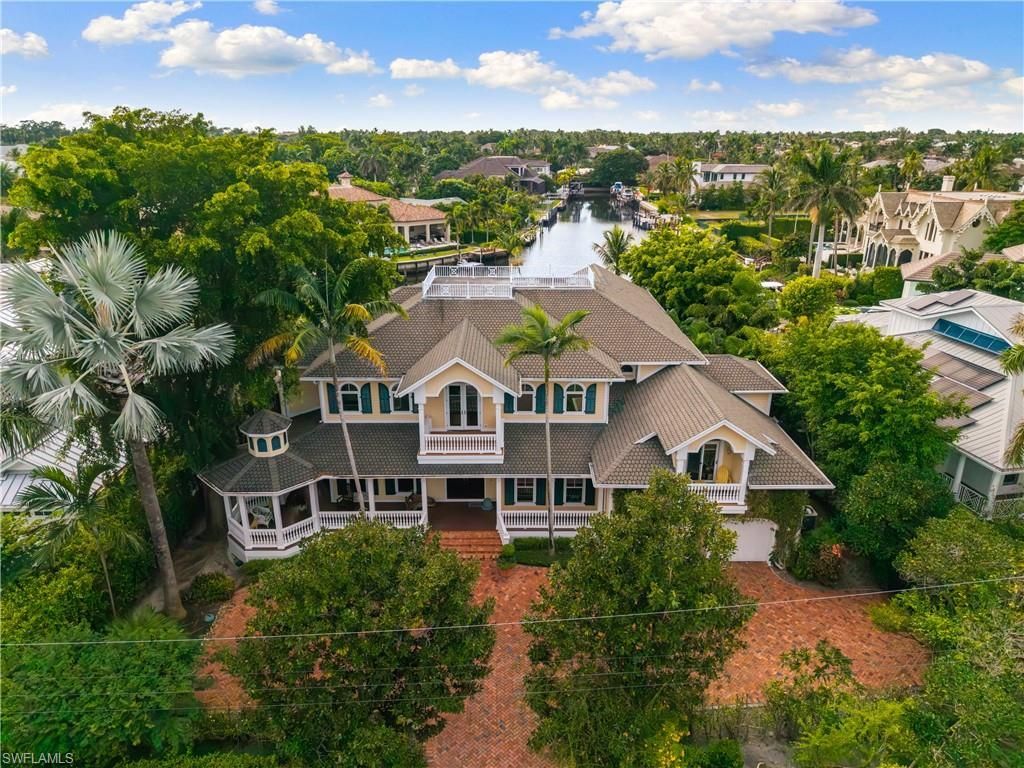
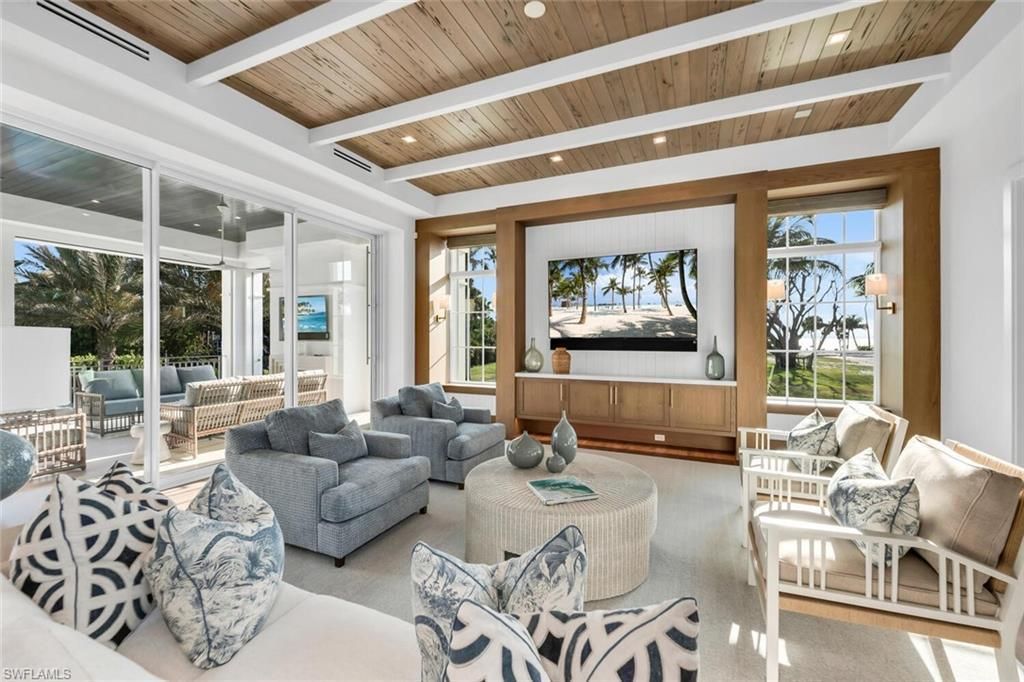
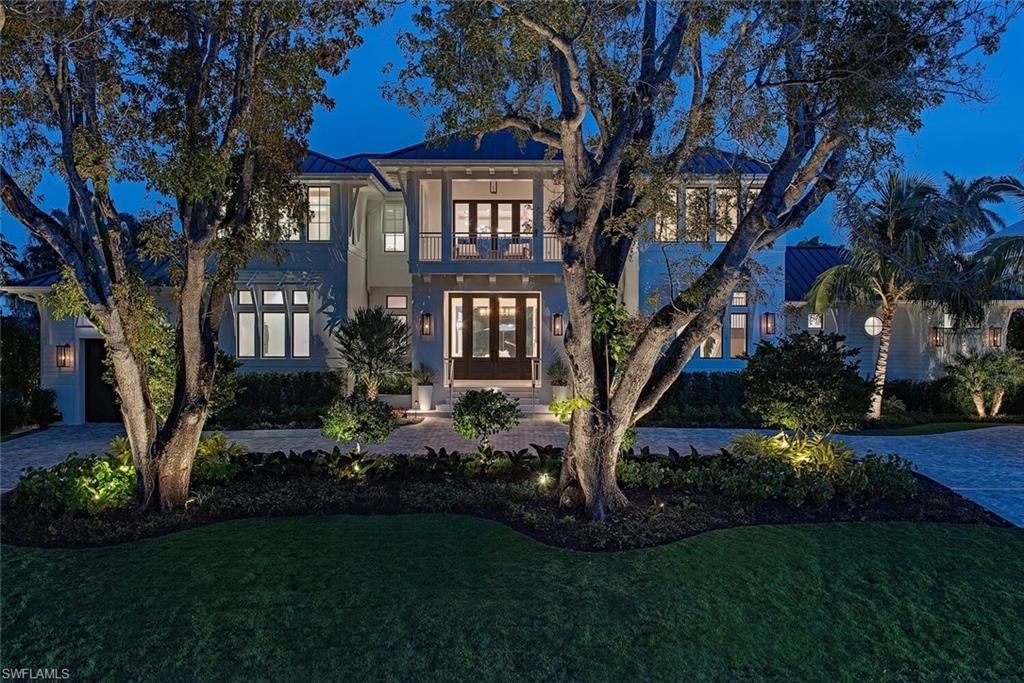
Explore Aqualane Shores
More About Aqualane Shores
Aqualane Shores Market Questions
Is Aqualane Shores a buyer’s or a seller’s market?
A buyer’s market at the moment. With 31 homes for sale against 27 sales over the last twelve months, Aqualane Shores carries almost fourteen months of supply, and the median sale closed at 83% of its original asking price. Canal-front homes, two-thirds of what is for sale, carry about twelve and a half months.
What is the median price in Aqualane Shores?
Across the 27 sales closed between October 1, 2025 and September 30, 2026, the median was $9,750,000 at $1,791 per square foot. Canal-front homes sold for a median $9,750,000, bay-front homes for $7,900,000 and homes off the water for $13,850,000, the last two on four sales each. The highest price was $20,925,000, for 1731 Gordon Drive in April 2026.
Are Aqualane Shores prices rising?
The median sale price rose to $9,750,000 from $7,450,000, and canal-front homes sold for a median $1,791 per square foot against $1,393. Across all homes, price per square foot was $1,791 against $1,878, so much of the rise in the median reflects which homes sold, and supply is now heavy.
How much below asking do Aqualane Shores homes sell for?
The median sale over the twelve months to September 30, 2026 closed at 83% of its original asking price and 91% of its final one, the same 83% as the year before, after a median 174 days on the market.
How often is this report updated?
On the first of every month, with the month just closed. This edition covers closed sales through September 30, 2026 and inventory as of October 1, 2026, from the Naples Area Board of REALTORS® MLS.
Can I get figures for a specific street or for prior months?
Yes. We hold the full sales history for Aqualane Shores and can prepare a report for any street, canal or home, including months earlier than this edition. Call (239) 438-1102 and tell us what you need.
Data source: Naples Area Board of REALTORS® MLS data for Aqualane Shores. Inventory as of October 1, 2026; closed-sale figures cover October 1, 2025 through September 30, 2026, compared with October 1, 2024 through September 30, 2025. Unsold listings are those terminated or withdrawn during September 2026. Segment definitions are our own and are set out above. Market data is deemed reliable but not guaranteed and is not a valuation of any individual property.
Meet the Team
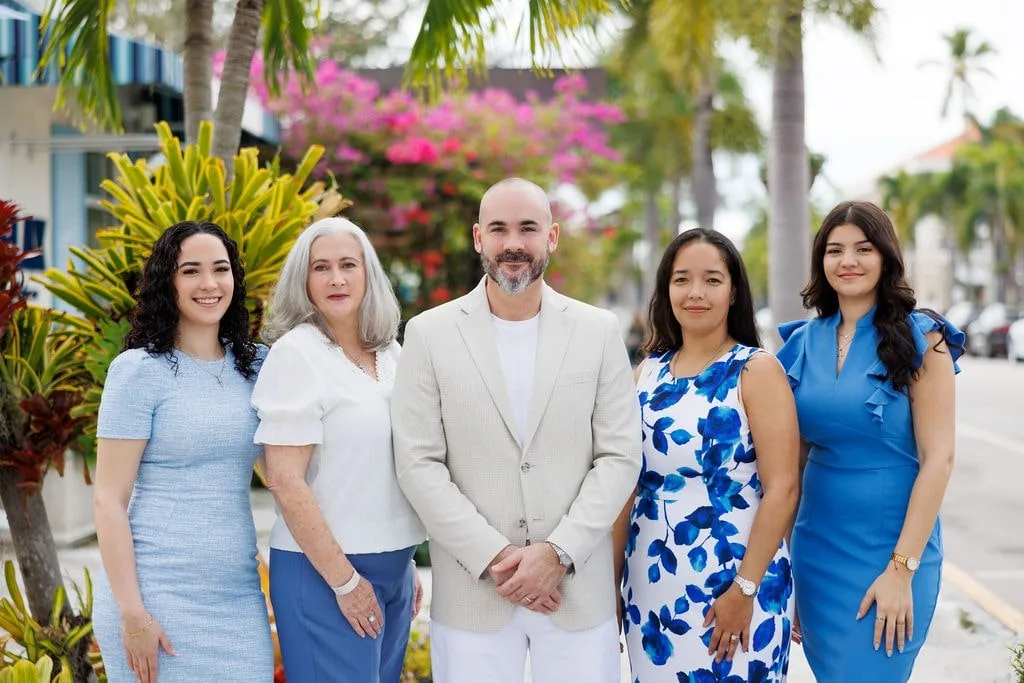
Connect with Real Estate Advisors... not Salespeople.
Alpizar & Company is a family-owned independent brokerage specializing in luxury waterfront real estate across Naples' most sought-after neighborhoods. Led by Robert Alpizar (CLHMS, GRI, SRS, PSA) and Marlene Alpizar, our team operates as advisors — not salespeople — guiding buyers and sellers with firsthand local expertise and no corporate quotas.
We offer complimentary, pressure-free consultations without any commitment.
How can we Help?
Over 250 closed transactions. $100 million in Naples luxury waterfront sales. Read what our buyers and sellers say about working with an advisor-driven independent brokerage — and why they come back.
What's it like working with Alpizar & Company?