
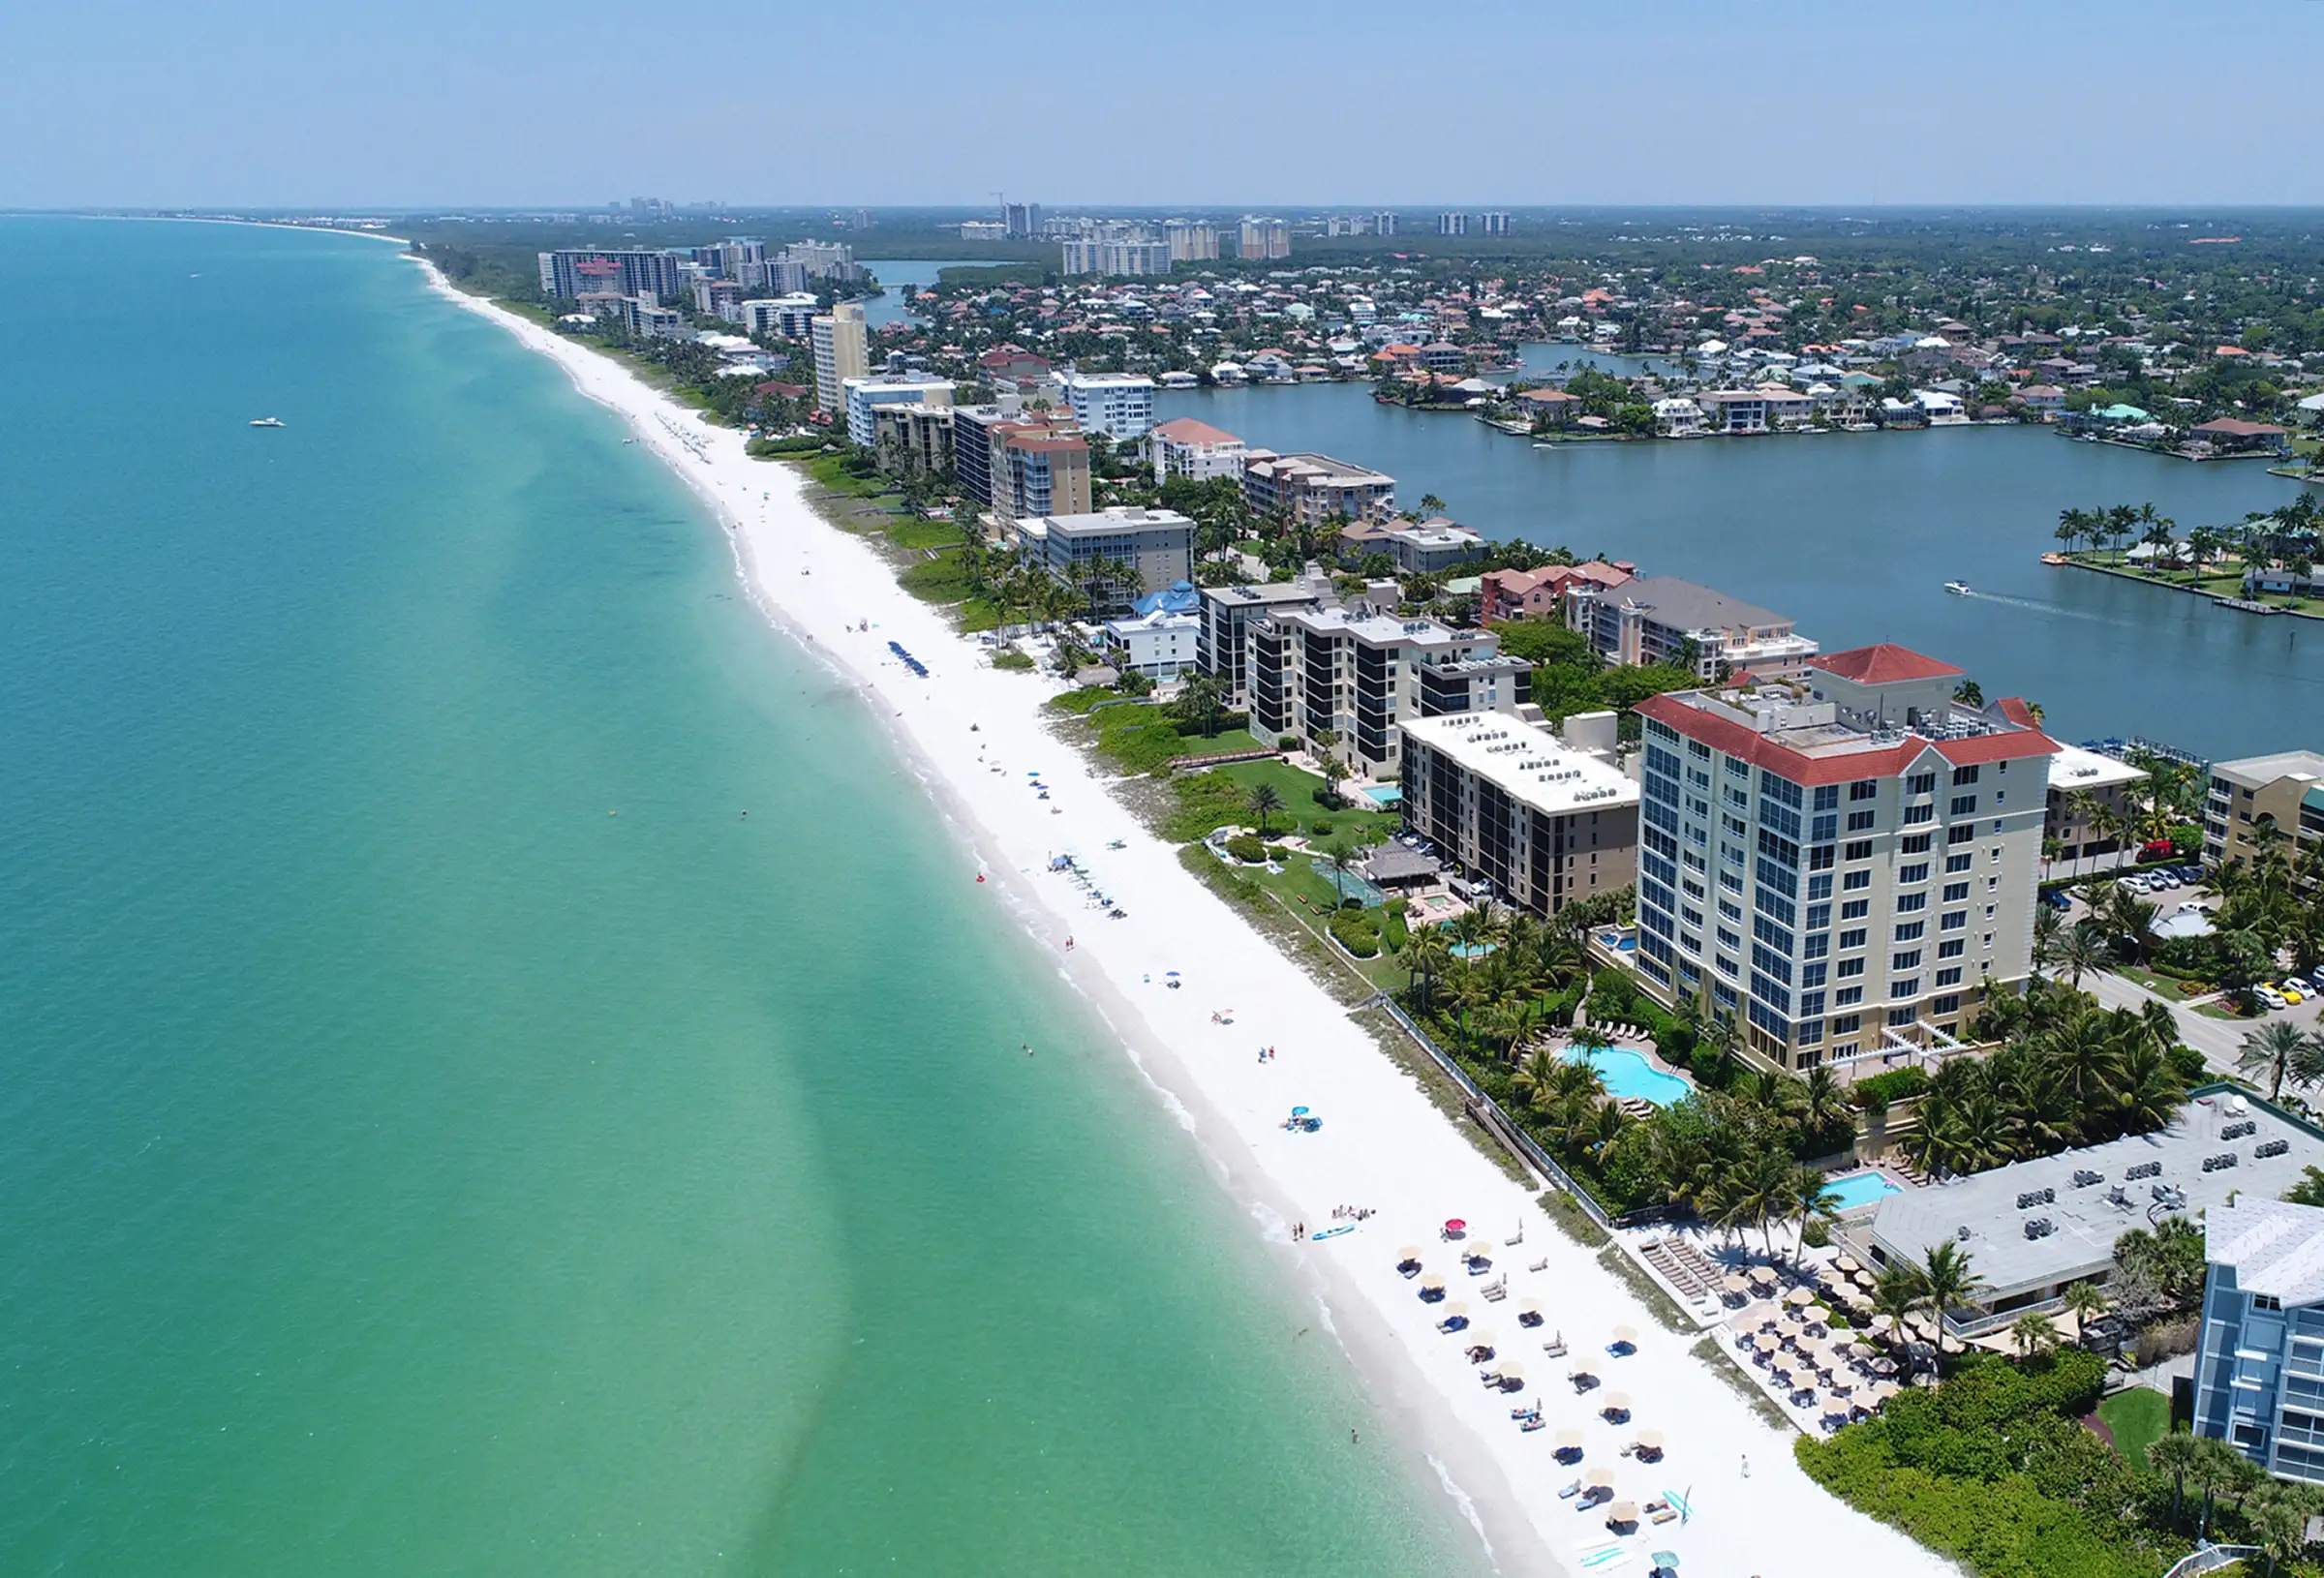
Five Vanderbilt Beach properties closed in August. Fourteen came off the market without selling — expired, terminated or withdrawn. Nearly three failures for every sale, and six of those fourteen were single-family homes in Conners.
That ratio invites an easy conclusion: demand has gone. The data says otherwise, and the distinction matters enormously if you are holding a listing right now.
The market is working in one segment and stalling in another
Gulf-front condominiums on Vanderbilt Beach carry 3.3 months of supply, sell in a median 93 days, and close at 94.7 percent of asking. That is a functioning seller's market by any definition. Nothing about it suggests buyers have left.
Conners single-family homes, a few hundred yards inland, carry 9.4 months of supply and a median 124 days. Bay-front condominiums sit between them at 5.3 months. Same neighborhood, same buyer pool, same month — and three completely different outcomes.
What separates them is the ask, not the address
Compare what sellers are asking per square foot today against what buyers have actually paid over the last twelve months, and the pattern resolves immediately.
Gulf-front condominiums are asking about five percent above achieved figures. The Bluebill peninsula buildings, thirteen percent. Bay-front condominiums and Conners homes are both asking roughly forty-five percent more per square foot than anything has actually sold for.
A forty-five percent gap is not a negotiating position. It is a listing the market will not engage with, and the market's response is exactly what the August numbers show: months of accumulated supply, days on market past two hundred, and listings that expire rather than close.
Why the comparable you are using is probably wrong
Most sellers price against what the neighbors are asking. It feels like the safest reference point — it is visible, it is current, and it is what every portal shows you.
It is also how a forty-five percent gap forms in the first place. When each new listing is priced against the last optimistic one rather than against a closed sale, the asking prices in a segment drift upward together while the achieved prices do not move at all. Every seller in that group believes they are priced in line with the market. They are priced in line with each other.
The only comparable that carries information is the one that closed.
What we would tell you at the listing appointment
Price against achieved figures and expect a negotiation on top: the median Vanderbilt Beach sale over the last twelve months came in at 94.1 percent of list, and Conners homes at 91.9 percent.
Then think about timing. Closings peaked at twenty-three in May against five in August — but a closing follows its contract by thirty to sixty days, so that May peak is really February and March buyers. A listing that is live and properly presented before season builds catches them. One that launches in June is competing for the thinnest months of the year.
And read the failure rate as the warning it is. Fourteen sellers spent August paying taxes, insurance and association fees on a property the market had already declined, and each of them now carries a listing history every future buyer can see.
The full numbers
Inventory and absorption by segment, twelve-month medians, price per square foot, days on market, and every August closing listed individually are in the Vanderbilt Beach Market Report, which we update on the first of every month.
If you are weighing a sale, we prepare a confidential valuation from the sales that genuinely compare to your residence — and we will tell you plainly if the number you have in mind is not in the data. See Selling in Vanderbilt Beach or call (239) 438-1102.
Posted by Robert Alpizar onEnjoy this blog post? Click here to subscribe for updates
Leave A Comment