
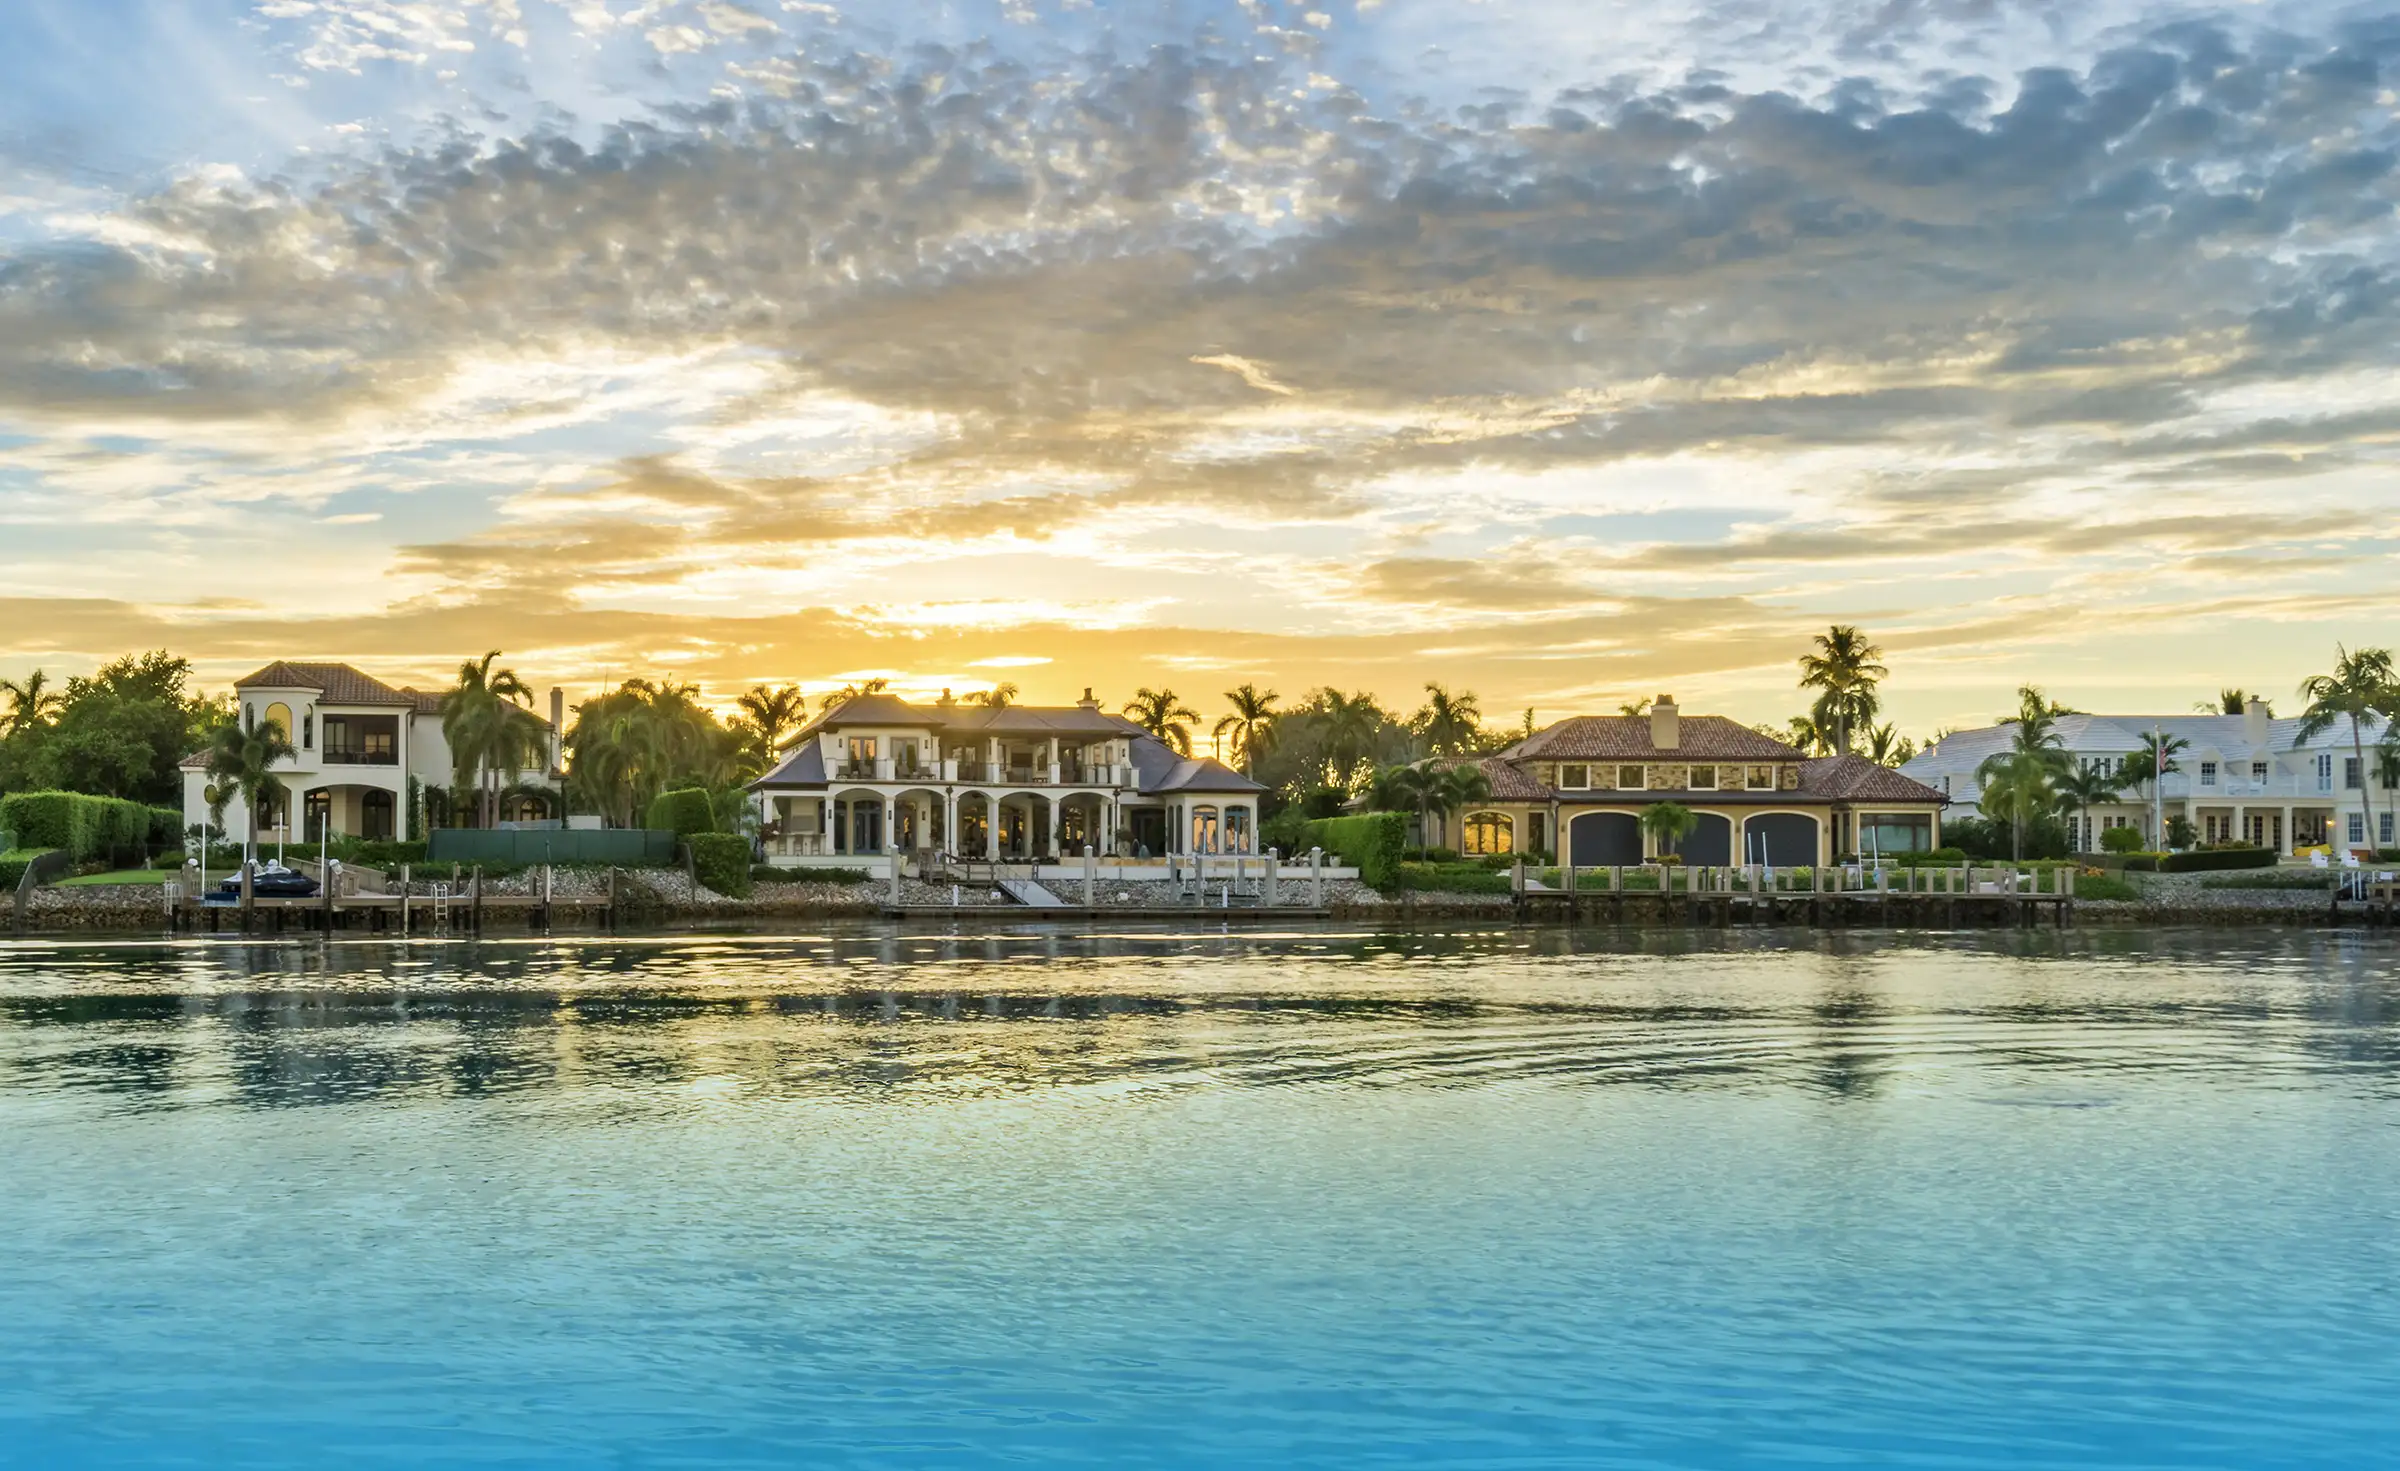
Sixty-four waterfront homes and condominiums closed in Naples in September for $311.5 million, twenty more than in September 2025 and the most in any month since June. Over the twelve months to September 30, 2026, 911 salt-water properties sold for $2.97 billion, 37% more sales than the year before, and more than four in five buyers paid cash.
On the first of every month we publish a full market report for each of the city’s principal waterfront neighborhoods, built from closed MLS sales rather than estimates. This is the one-page view of all of them, with a link to each.
The Naples Waterfront at a Glance
| September closings | 64 waterfront sales for $311.5 million, against 44 a year earlier |
| Twelve-month sales | 911 salt-water homes and condominiums, against 665 the year before |
| Dollar volume | $2.97 billion, up 22% from $2.44 billion |
| Median price | $1,600,000, at $804 per square foot |
| Months of supply | 7.2 across the waterfront, from under six on the Gulf to about eight and a half on the canals |
| Cash buyers | 82% of the year’s sales, and 90% above $3 million |
Every Report in One Table
Twelve-month sales and median price for each neighborhood, with months of supply on October 1, 2026. Each neighborhood report counts every sale in that neighborhood, on the water and off it; the last row covers salt-water property across the whole city.
| Report | Sales | Median |
|---|---|---|
| Port Royal 7.2 months of supply |
30 sales 27 prior year |
$17,690,000 median price |
| Aqualane Shores 13.8 months of supply |
27 sales 30 prior year |
$9,750,000 median price |
| Bay Colony 3.5 months of supply |
44 sales 44 prior year |
$4,500,000 median price |
| Royal Harbor 10.9 months of supply |
22 sales 16 prior year |
$3,000,000 median price |
| Olde Naples 9.2 months of supply |
155 sales 139 prior year |
$2,430,000 median price |
| Park Shore 5.6 months of supply |
261 sales 187 prior year |
$1,800,000 median price |
| The Dunes 4.9 months of supply |
34 sales 23 prior year |
$1,780,000 median price |
| Coquina Sands 12.0 months of supply |
31 sales 13 prior year |
$1,540,000 median price |
| Pelican Bay 3.9 months of supply |
304 sales 246 prior year |
$1,340,000 median price |
| The Moorings 5.8 months of supply |
218 sales 163 prior year |
$1,280,000 median price |
| Vanderbilt Beach 6.4 months of supply |
116 sales 82 prior year |
$1,130,000 median price |
| Isles of Capri 12.0 months of supply |
30 sales 32 prior year |
$820,000 median price |
| All Naples waterfront 7.2 months of supply |
911 sales 665 prior year |
$1,600,000 median price |
Twelve months to September 30, 2026, against the twelve months before. Pelican Bay excludes Bay Colony. Source: Naples Area Board of REALTORS® MLS.
Supply Splits the Market in Two
At the north end, the beachfront communities are short of inventory: Bay Colony holds three and a half months of supply, Pelican Bay under four and The Dunes under five. To the south, the estate and canal neighborhoods carry close to a year or more: Aqualane Shores almost fourteen months, Coquina Sands and Isles of Capri twelve, and Royal Harbor almost eleven. The same city, the same month, and two very different negotiations.
Where Supply Is High, the Ask Is the Reason
The neighborhoods with the most supply are also where sellers are asking furthest above what buyers pay. Royal Harbor listings ask about 40% more per square foot than the year’s sales achieved, and in two of the four Vanderbilt Beach segments the gap is about 50%. Across the whole waterfront it is about 15%. A listing priced on what the neighbors are asking, rather than what they sold for, waits.
Where Buyers Compete, Prices Are Rising
On the water in Port Royal, homes sold for about 18% more per square foot than a year earlier, and sellers there are giving up far less from their first price. Waterfront homes on Isles of Capri rose about 23% a foot. Park Shore sales rose 40%, with its premium high-rise towers left with almost nothing for sale, and Gulf-front condominium sales in The Moorings more than doubled.
The Sale That Sums Up the Year
The year’s highest price on the Naples waterfront, $62,500,000 for 20 14th Avenue South in Olde Naples, closed in September at 63% of its original $99,000,000 asking price after 688 days on the market. At every price level the pattern holds: the market pays for a property priced correctly at launch, and it makes an overpriced one wait.
What This Means
For sellers, the right comparison is what closed on your kind of water in your own neighborhood, and the reports above give it street by street and building by building. For buyers, the high-supply neighborhoods are where negotiation still works, while at the north end the best residences go quickly. Every report is updated on the first of the month; the Naples Waterfront Market Report brings them together across the whole city.
If you are weighing a sale, we prepare a confidential valuation from the sales that genuinely compare to your property, and we will tell you plainly if the number you have in mind is not in the data. See selling a waterfront home in Naples or call (239) 438-1102.
Posted by Robert Alpizar onEnjoy this blog post? Click here to subscribe for updates
Leave A Comment